
- Title
-
Efficient removal of toxicity associated to wastewater treatment plant effluents by enhanced Soil Aquifer Treatment
- Authors
- Sanz, C., Sunyer-Caldú, A., Casado, M., Mansilla, S., Martinez-Landa, L., Valhondo, C., Gil-Solsona, R., Gago-Ferrero, P., Portugal, J., Diaz-Cruz, M.S., Carrera, J., Piña, B., Navarro-Martín, L.
- Source
- Full text @ J. Hazard. Mater.
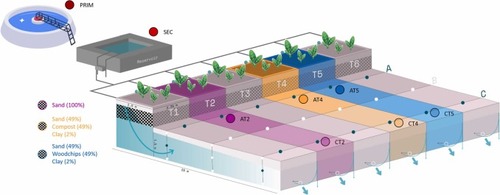
Simplified scheme of the pilot SAT system. The three SAT systems with different barrier compositions studied in the present work are represented. Color pink codes for the SAT without reactive barrier filled only with sand, color orange codes for the SAT with a reactive barrier made of sand (49%), compost (49), and clay (2%), and color blue codes for the SAT with a reactive barrier made of sand (49%), woodchips (49), and clay (2%). Samples were taken prior WWTP treatment (PRIM), after WWTP at the effluent reservoir (SEC), after the immediate passage through the reactive barrier (A), and at the very end of the systems (C). Water samples were collected in two different campaigns, June and October 2020 (further referred as JUN20, and OCT20, respectively), through a recharge period with a continuous allocated inflow and a recharge period with a pulsating allocated inflow, respectively. |
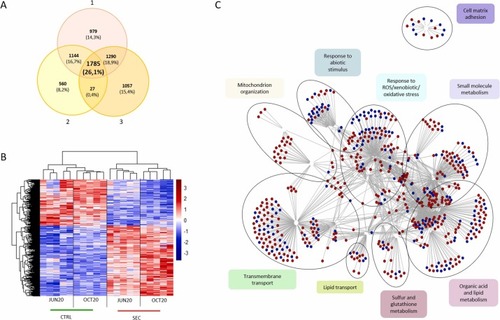
Differentially expressed genes (DEGs) between zebrafish eleutheroembryos exposed to SEC and CTRL extracts. A) Venn diagram illustrates 1785 common DEGs identified using three different approaches: 1) DEGs regardless of campaign, 2) DEGs identified in the JUN20 campaign, 3) DEGs identified in the OCT20 campaign. B) Heatmap shows the normalized count data of DEGs in both campaigns separately. C) Enrichment analysis for the 1785 common DEGs. Network displays all the enriched biological processes, illustrating the mutual interaction between the different pathways. Note that similar nodes have been grouped into broader, easy to interpret functional descriptions. Red and blue nodes in network code for up and down regulated genes respectively |
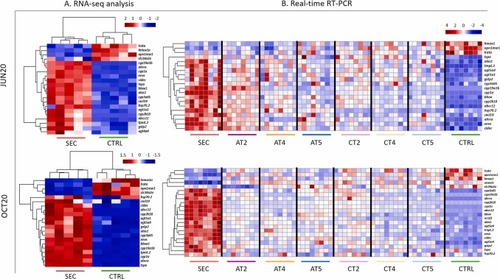
Abundance of mRNA biomarkers before and after SAT treatment for both JUN20 and OCT20 campaigns. A) Heatmaps of normalized counts (obtained by RNA-seq) of the selected transcriptomic biomarkers in eleuteroembryos exposed to SEC and CTRL water extracts. B) Heatmaps showing fold change transcriptomic data (obtained by real time RT-PCR) from eleuteroembryos exposed to SEC, ATs, CTs and CTRL water extracts. In both cases, data was scaled and centered. |
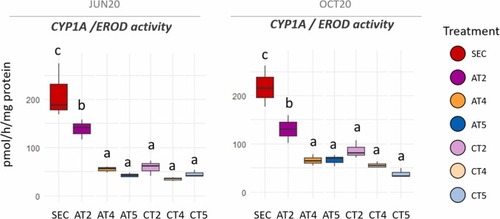
EROD activity of HepG2 cells exposed to SEC, AT, and CT water extracts. Letters denote statistical differences amongst experimental groups (ANOVA test, followed by pairwise comparisons using Tukey`s test, p < 0.05). |
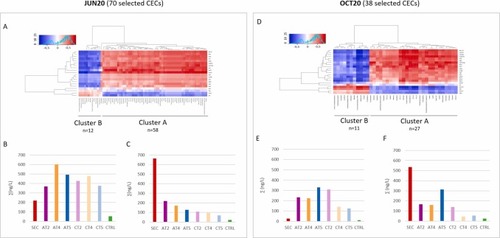
Heatmap showing correlation (red positive, blue negative) between concentrations of specific CECs (selected by ANOVA-PLS2) in the water extracts and mRNA levels of the eleutheroembryos exposed to the same water extracts from both JUN20 (A) and OCT20 (D) campaigns. Correlations validated ANOVA-PLS2 analysis finding significative correlations between the selected CECs that best predicted the transcriptomic responses and the biological data. Bar plot graphs, show the sum of CECs concentrations (ng/L) of the compounds identified in clusters A (C and F graphs) and B (B and E graphs). |
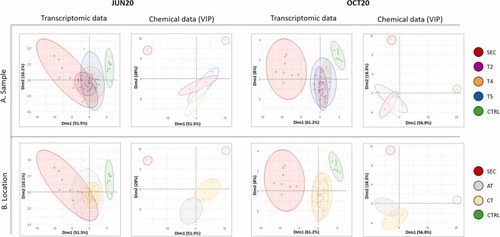
Principal Component Analysis (PCA) of the biological (mRNA abundance in exposed eleutheroembryos) and the chemical data (CECs relative abundance in the water extracts) for JUN20 and OCT20 campaigns. A) Color coding differentiates between SEC, SATs, and CTRL samples. B) Color coding differentiates between sampling location including SEC, A, C and CTRL samples. |
Reprinted from Journal of hazardous materials, 465, Sanz, C., Sunyer-Caldú, A., Casado, M., Mansilla, S., Martinez-Landa, L., Valhondo, C., Gil-Solsona, R., Gago-Ferrero, P., Portugal, J., Diaz-Cruz, M.S., Carrera, J., Piña, B., Navarro-Martín, L., Efficient removal of toxicity associated to wastewater treatment plant effluents by enhanced Soil Aquifer Treatment, 133377133377, Copyright (2023) with permission from Elsevier. Full text @ J. Hazard. Mater.