
|
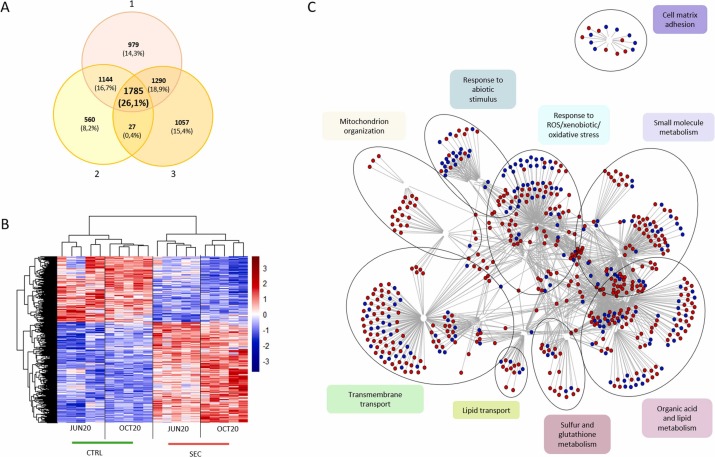
Fig. 2 Differentially expressed genes (DEGs) between zebrafish eleutheroembryos exposed to SEC and CTRL extracts. A) Venn diagram illustrates 1785 common DEGs identified using three different approaches: 1) DEGs regardless of campaign, 2) DEGs identified in the JUN20 campaign, 3) DEGs identified in the OCT20 campaign. B) Heatmap shows the normalized count data of DEGs in both campaigns separately. C) Enrichment analysis for the 1785 common DEGs. Network displays all the enriched biological processes, illustrating the mutual interaction between the different pathways. Note that similar nodes have been grouped into broader, easy to interpret functional descriptions. Red and blue nodes in network code for up and down regulated genes respectively
Reprinted from Journal of hazardous materials, 465, Sanz, C., Sunyer-Caldú, A., Casado, M., Mansilla, S., Martinez-Landa, L., Valhondo, C., Gil-Solsona, R., Gago-Ferrero, P., Portugal, J., Diaz-Cruz, M.S., Carrera, J., Piña, B., Navarro-Martín, L., Efficient removal of toxicity associated to wastewater treatment plant effluents by enhanced Soil Aquifer Treatment, 133377, Copyright (2023) with permission from Elsevier. Full text @ J. Hazard. Mater.