
Image
|
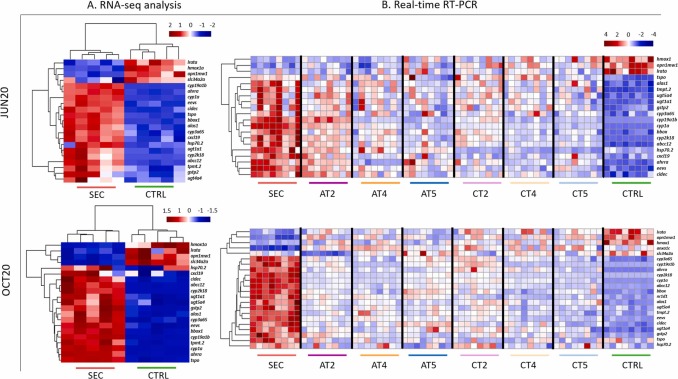
Figure Caption
Fig. 3 Abundance of mRNA biomarkers before and after SAT treatment for both JUN20 and OCT20 campaigns. A) Heatmaps of normalized counts (obtained by RNA-seq) of the selected transcriptomic biomarkers in eleuteroembryos exposed to SEC and CTRL water extracts. B) Heatmaps showing fold change transcriptomic data (obtained by real time RT-PCR) from eleuteroembryos exposed to SEC, ATs, CTs and CTRL water extracts. In both cases, data was scaled and centered.
Acknowledgments
This image is the copyrighted work of the attributed author or publisher, and
ZFIN has permission only to display this image to its users.
Additional permissions should be obtained from the applicable author or publisher of the image.
Reprinted from Journal of hazardous materials, 465, Sanz, C., Sunyer-Caldú, A., Casado, M., Mansilla, S., Martinez-Landa, L., Valhondo, C., Gil-Solsona, R., Gago-Ferrero, P., Portugal, J., Diaz-Cruz, M.S., Carrera, J., Piña, B., Navarro-Martín, L., Efficient removal of toxicity associated to wastewater treatment plant effluents by enhanced Soil Aquifer Treatment, 133377133377, Copyright (2023) with permission from Elsevier. Full text @ J. Hazard. Mater.