
FIGURE
Fig. 5
- ID
- ZDB-FIG-240410-21
- Publication
- Sanz et al., 2023 - Efficient removal of toxicity associated to wastewater treatment plant effluents by enhanced Soil Aquifer Treatment
- Other Figures
- All Figure Page
- Back to All Figure Page
Fig. 5
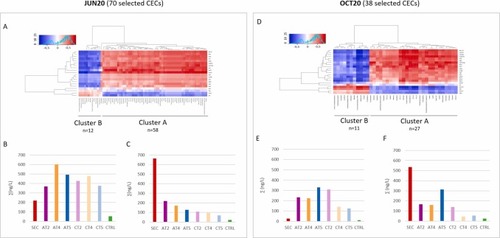
Heatmap showing correlation (red positive, blue negative) between concentrations of specific CECs (selected by ANOVA-PLS2) in the water extracts and mRNA levels of the eleutheroembryos exposed to the same water extracts from both JUN20 (A) and OCT20 (D) campaigns. Correlations validated ANOVA-PLS2 analysis finding significative correlations between the selected CECs that best predicted the transcriptomic responses and the biological data. Bar plot graphs, show the sum of CECs concentrations (ng/L) of the compounds identified in clusters A (C and F graphs) and B (B and E graphs). |
Expression Data
Expression Detail
Antibody Labeling
Phenotype Data
Phenotype Detail
Acknowledgments
This image is the copyrighted work of the attributed author or publisher, and
ZFIN has permission only to display this image to its users.
Additional permissions should be obtained from the applicable author or publisher of the image.
Reprinted from Journal of hazardous materials, 465, Sanz, C., Sunyer-Caldú, A., Casado, M., Mansilla, S., Martinez-Landa, L., Valhondo, C., Gil-Solsona, R., Gago-Ferrero, P., Portugal, J., Diaz-Cruz, M.S., Carrera, J., Piña, B., Navarro-Martín, L., Efficient removal of toxicity associated to wastewater treatment plant effluents by enhanced Soil Aquifer Treatment, 133377, Copyright (2023) with permission from Elsevier. Full text @ J. Hazard. Mater.