- Title
-
Huoxin pill protects verapamil-induced zebrafish heart failure through inhibition of oxidative stress-triggered inflammation and apoptosis
- Authors
- Li, X., Zeng, L., Qu, Z., Zhang, F.
- Source
- Full text @ Heliyon
|
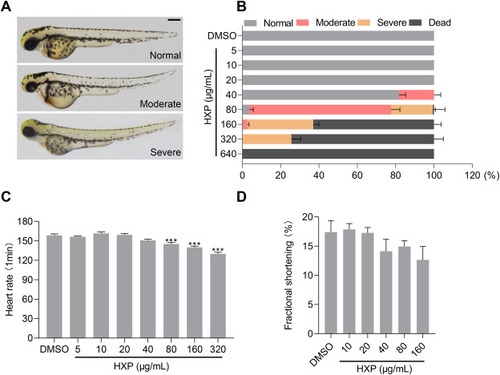
Effects of HXP on the phenotype and cardiac function of zebrafish embryos A. Zebrafish embryos at 48 hpf were exposed to various doses of HXP (0–640 μg/mL) for 4 h. The phenotypes were classified as normal, moderate and severe, scale bar = 200 μm. B. Statistics of phenotypic proportions of zebrafish embryos exposed to different doses of HXP (0–640 μg/mL) for 4 h, n = 30, the experiment was replicated three times. C. Statistics of the heart rate of zebrafish embryos exposed to different doses of HXP (0–320 μg/mL) for 4 h, n = 30, compared with those of the 0 μg/mL treated group. D. Statistics of heart fractional shortening of zebrafish embryos exposed to different doses of HXP (0–160 μg/mL) for 4 h, n = 10, compared with those of the 0 μg/mL treated group (DMSO group). |
|
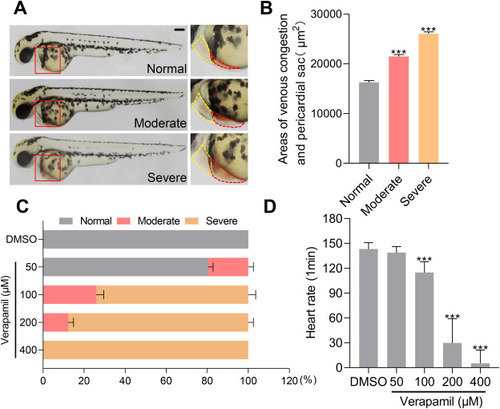
Effects of verapamil on cardiac phenotype and heart rate of zebrafish embryos A. 52 hpf zebrafish embryos were exposed to various doses of verapamil (0–400 μM) for 30 min. The phenotypes were classified as normal, moderate and severe according to the area of the pericardial sac and venous congestion. The yellow and red-dotted lines indicate the area of the pericardial sac and venous congestion, respectively, scale bar = 200 μm. B. Statistics of phenotypic proportions of zebrafish embryos exposed to different doses of verapamil (0–400 μM) for 30 min, n = 30, the experiment was replicated three times. C. Statistics of heart rate of zebrafish embryos exposed to different doses of verapamil (0–400 μM) for 30 min, n = 30, compared with those of the 0 μM treated group (DMSO group). |
|
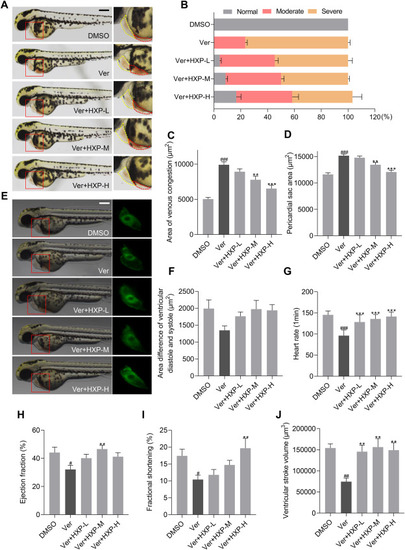
HXP protects against verapamil-induced zebrafish HF in a dose-dependent manner A. Zebrafish embryos at 48 hpf were pretreated with low, medium or high doses of HXP for 4 h followed by exposure to 100 μM verapamil for 30 min. Representative pictures of zebrafish embryos in each group are shown. The yellow and red-dotted lines indicate the area of the pericardial sac and venous congestion, respectively, scale bar = 200 μm. B. The phenotypes of embryos were classified as normal, moderate and severe according to the area of the pericardial sac and venous congestion, and the phenotypic proportions of zebrafish embryos in each group were statistically analyzed, n = 30. The experiment was replicated three times. C. Statistics of venous congestion area of zebrafish embryos in each group, n = 10. D. Statistics of the pericardial sac area of zebrafish embryos in each group, n = 11. E. Representative pictures of zebrafish heart morphology in each group, noting that the heart was dilated in the verapamil group and that the malformation of the heart could be rescued by different doses of HXP. F. Statistics of the area difference of ventricular diastole and systole of zebrafish embryos in each group, n = 10. G. Statistics of the heart rate of zebrafish embryos in each group, n = 30. H. Statistics of the ejection fraction of zebrafish hearts in each group, n = 11. I. Statistics of fraction shortening of zebrafish hearts in each group, n = 7; J. Statistics of cardiac stroke volume of zebrafish embryos in each group, n = 11. #, ### Compared with the control group (DMSO group); *, **, *** compared with the verapamil group. |
|
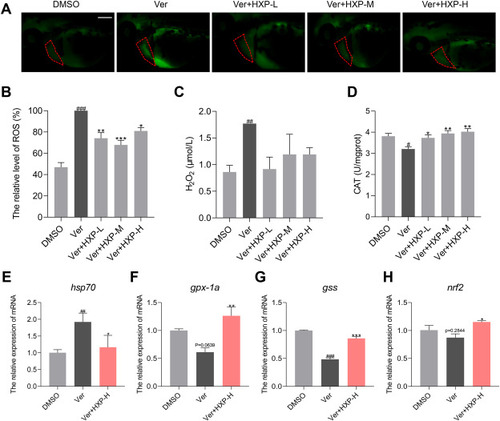
HXP alleviates verapamil-induced oxidative stress in the zebrafish HF model A. Representative pictures of zebrafish embryos labeled with the ROS probe in each group. Red dotted lines indicate the heart area, and the fluorescence intensity represents the ROS content in the heart, scale bar = 200 μm. B. The relative level of ROS in zebrafish hearts of each group. The ROS level in the verapamil group was set as 100 %, n = 9. C. H2O2 content of zebrafish embryos in each group, n = 20, the experiment was replicated three times. D. CAT level of zebrafish embryos in each group, n = 20, the experiment was replicated three times. E. Relative mRNA expression of hsp70 in zebrafish embryos in each group. F. Relative mRNA expression of gpx-1a in zebrafish embryos in each group. G. Relative mRNA expression of gss in zebrafish embryos in each group. H. Relative mRNA expression of nrf2 in zebrafish embryos in each group. ##, ### Compared with the control group (DMSO group); *, **, *** compared with the verapamil group. |
|
HXP protects zebrafish embryos from verapamil-induced heart inflammation A. Representative embryos in each group showing neutrophil infiltration in hearts. Red dotted lines show the heart region, scale bar = 200 μm. B. Statistics of the number of neutrophils in zebrafish hearts of each group, n = 15, the experiment was replicated three times. C. Statistics of the proportion of NF-κB-positive embryos in each group, n = 20, the experiment was replicated three times. D. Representative images of NF-κB-positive embryos in each group, scale bar = 200 μm. E. Statistics of the fluorescence area of NF-κB-positive embryos in each group, n = 7. F. Relative mRNA expression of nfkb1 in zebrafish embryos in each group. G. Relative mRNA expression of tnf-α in zebrafish embryos in each group. H. Relative mRNA expression of il-6 in zebrafish embryos in each group. I. Relative mRNA expression of lck in zebrafish embryos in each group. #, ##, ### Compared with the control group (DMSO group); *, **, *** compared with the verapamil group. |
|
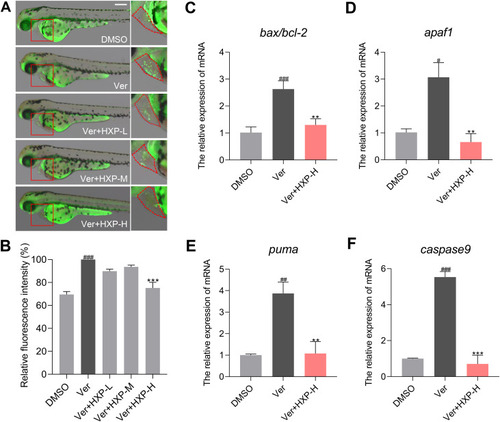
HXP inhibits verapamil-induced cardiac apoptosis in zebrafish embryos A. Representative embryos with AO staining in each group. Red dotted lines show the heart region with apoptotic cells, scale bar = 200 μm. B. Relative quantification of the fluorescence intensity of zebrafish hearts in each group. The fluorescence intensity in the verapamil group was set as 100 %, n = 9. C. The relative mRNA expression ratio of bax to bcl-2 in zebrafish embryos in each group. D. Relative mRNA expression of apaf1 in zebrafish embryos in each group. E. Relative mRNA expression of puma in zebrafish embryos in each group. F. Relative mRNA expression of caspase9 in zebrafish embryos in each group. #, ##, ### Compared with the control group (DMSO group); *, ** compared with the verapamil group. |
|
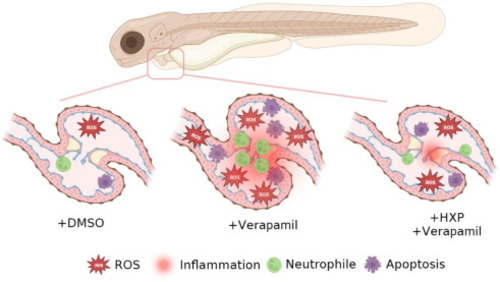
Diagram illustrating the mechanism by which HXP alleviates verapamil-induced HF in zebrafish embryos. |

