
|
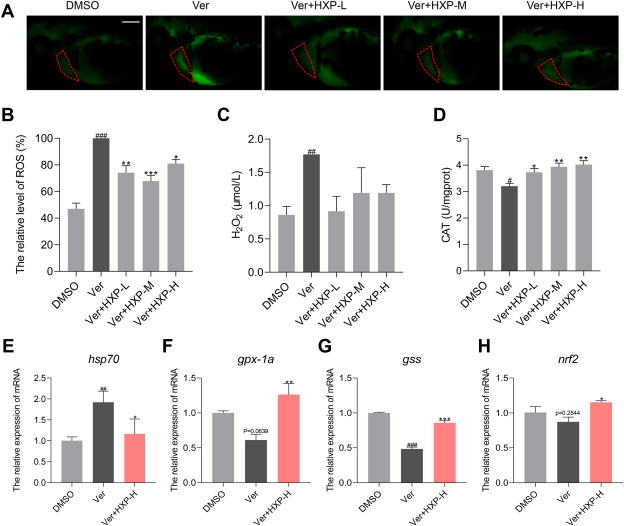
Fig. 4 HXP alleviates verapamil-induced oxidative stress in the zebrafish HF model A. Representative pictures of zebrafish embryos labeled with the ROS probe in each group. Red dotted lines indicate the heart area, and the fluorescence intensity represents the ROS content in the heart, scale bar = 200 μm. B. The relative level of ROS in zebrafish hearts of each group. The ROS level in the verapamil group was set as 100 %, n = 9. C. H2O2 content of zebrafish embryos in each group, n = 20, the experiment was replicated three times. D. CAT level of zebrafish embryos in each group, n = 20, the experiment was replicated three times. E. Relative mRNA expression of hsp70 in zebrafish embryos in each group. F. Relative mRNA expression of gpx-1a in zebrafish embryos in each group. G. Relative mRNA expression of gss in zebrafish embryos in each group. H. Relative mRNA expression of nrf2 in zebrafish embryos in each group. ##, ### Compared with the control group (DMSO group); *, **, *** compared with the verapamil group.