
- Title
-
Generation of a Zebrafish Knock-In Model Recapitulating Childhood ETV6::RUNX1-Positive B-Cell Precursor Acute Lymphoblastic Leukemia
- Authors
- Zapilko, V., Moisio, S., Parikka, M., Heinäniemi, M., Lohi, O.
- Source
- Full text @ Cancers
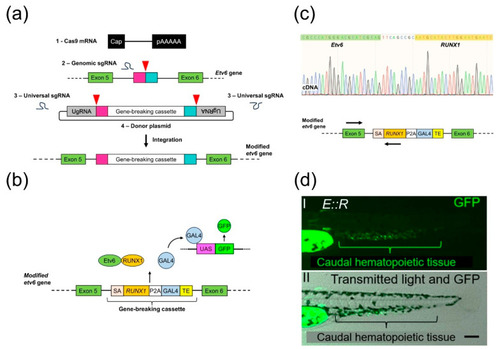
Generation of the |

Flow cytometry analysis of major blood cell lineages in the whole kidney marrow of the |
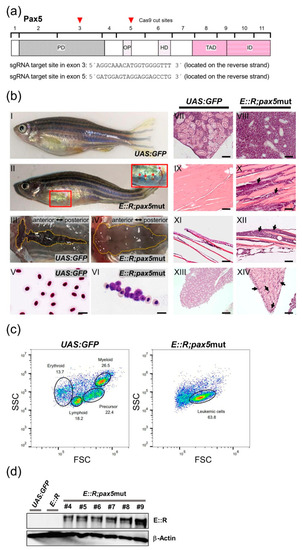
CRISPR/Cas9 targeting of the |

Generation of |
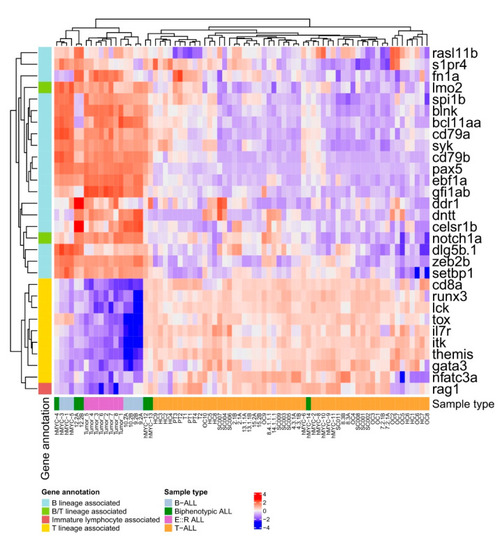
Heatmap visualization of the significantly differentially expressed B and T lineage-associated genes between the B-ALL and |