FIGURE SUMMARY
Title

TFAP2 paralogs regulate midfacial development in part through a conserved ALX genetic pathway

Authors
Nguyen, T.T., Mitchell, J.M., Kiel, M.D., Kenny, C.P., Li, H., Jones, K.L., Cornell, R.A., Williams, T.J., Nichols, J.T., Van Otterloo, E.
Source
Full text @ Development

TFAP2A and TFAP2B cooperatively function in CNCCs during midfacial development. (A-D′) Lateral (A-D) or frontal (A′-D′) views of prenatal mice on embryonic day 18.5 (E18.5). Genotypes are as follows: CTRL (CRE-negative, any Tfap2a/b allelic combination; CRE-positive; Tfap2a+/flox; Tfap2b+/flox), Tfap2aNCKO (CRE-positive; Tfap2aflox/flox; Tfap2b+/flox), Tfap2bNCKO (CRE-positive; Tfap2a+/flox; Tfap2bflox/flox) and Tfap2NCKO (CRE-positive; Tfap2aflox/flox; Tfap2bflox/flox). n=5 per genotype. Gold arrowheads in B and C indicate snout indentations. Insets in A′-D′ include higher magnification images of the snout, with misplaced vibrissae outlined. White arrowhead in D indicates the shortened snout; the asterisk indicates mandible hypoplasia. (E) Schematic summarizing regions of Tfap2a and Tfap2b gene deletion in various craniofacial tissues and the corresponding phenotypes (middle, this study; right, Van Otterloo et al., 2018). Regions of deletion are indicated by reduced color intensity.

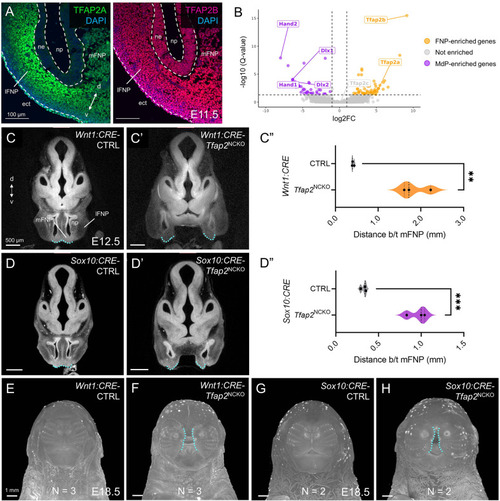
A prominent role for TFAP2A and TFAP2B in post-migratory midfacial CNCCs. (A) E11.5 wild-type midface tissue sections (horizontal angle) showing immunofluorescence of TFAP2A (left) and TFAP2B (right). White dashed lines indicate the ectoderm-mesenchyme boundaries. (B) Volcano plot displaying differentially expressed genes between E11.5 CNCCs occupying the mandibular prominence (MdP, purple) or frontonasal prominence (FNP, gold). (C-D″) Micro-computed tomography sections of E12.5 control-Tfap2NCKO littermate pairs in Wnt1:CRE (C-C′) and Sox10:CRE (D-D′) schemes. Blue dashed lines outline the medial domains of the FNP (mFNP), with the distance between them quantified and visualized as violin plots in C″ and D″. n=3 per genotype. Unpaired Student's t-test, **P<0.01, ***P<0.001. (E-H) Front view of micro-computed tomography-scanned E18.5 embryos, with indicated genotypes and sample sizes. Blue dashed lines highlight the midfacial cleft. d, dorsal; ect, ectoderm; lFNP, lateral FNP; ne, nasal epithelium; np, nasal pit; v, ventral.

Formation of midfacial bone and cartilage structures depends on Tfap2a and Tfap2b gene dose in CNCCs. (A-H′) Alizarin Red (bone) and Alcian Blue (cartilage) staining preparations of E18.5 Sox10:CRE (A-D) or Wnt1:CRE (E-H) animals, with indicated genotypes and maxilla removed. n=5 per genotype. Scale bars: 1 mm. Anterior (a) is towards the left, posterior (p) towards the right. (A-H) Top-down views of the midfacial skeleton. Gold dashed lines (A-H) outline the peripheral edges of the calvaria bones. White dashed lines (B,F,G) outline nasal bone gaps. Gold arrowheads (D,F-H) indicate cartilaginous ectopias adjacent to the frontal bones. Asterisks (D,H) highlight missing nasal bones. (A′-H′) Bottom-up views of the midfacial skeleton. White arrowheads (B′,F′) indicate a gap in the vomer bones. cs, coronal suture; fr, frontal bone; na, nasal bone; nl, nasal/ethmoid labyrinth; ns, nasal septum; pl, palatine bone; pmx, premaxilla; ppp, palatal process of the palatine; pppm, palatal process of the premaxilla; ppro, pila preoptica; ppso, pila postoptica; ps, presphenoid; vm, vomer bone.

Transcriptomic analyses reveal loss of TFAP2 genes compromises midface Alx1, Alx3 and Alx4 gene expression. (A) Bulk RNA-seq volcano plot of frontonasal and maxillary prominence (FNP/MxP) tissues isolated from E10.5 control and Tfap2Δ/NCKO littermates (cartoon workflow on the left). Downregulated (purple) and upregulated (gold) genes are shown. (B) Enrichr (Kuleshov et al., 2016) terms based on the RNA-seq downregulated genes. (C) Overview of the scRNA-seq experiment performed on E11.5 Tfap2HET controls and Tfap2NCKO mutants. The top box displays the workflow of sorting GFP-positive head CNCCs from pharyngeal arch 2 (PA2) and rostral of, and including, PA2. Created using Biorender.com. Below is the resulting uniform manifold approximation and projection (UMAP) plot of the three major groupings and genes enriched in each. The mesenchyme population is outlined and is further subset and re-clustered (D) using MAGIC imputation (van Dijk et al., 2018). Dashed lines on the mesenchyme UMAP indicate the positional identities, with their respective gene signatures. These include clusters for the FNP (two generated), MxP, mandibular prominence (MdP) and PA2. (E) Violin plots of Alx1, Alx3 and Alx4 gene expression between conditions and divided based on clusters. The FNP clusters are outlined. (F) Frontal view of whole-mount in situ hybridizations for Alx3 and Alx4 between E10.5 controls and Tfap2Δ/NCKO mutants. Scale bars: 500 µm. Dashed lines outline the FNP. (G,H) Real-time PCR analysis for Alx1, Alx3 and Alx4 gene expression based on cDNA generated from E11.5 FNP/MxP CNCCs sorted from Tfap2HET-Tfap2NCKO pairs (G) or E10.5 medial and lateral FNP (mFNP, lFNP) bulk tissue isolated from control-Tfap2Δ/NCKO pairs (H).

ChIP-seq profiling identifies TFAP2 paralogs directly bind Alx1, Alx3 and Alx4 regulatory elements. (A) Cartoon workflow for anti-TFAP2 ChIP-seq of wild-type E11.5 C57BL/6 facial prominence tissues. (B) Density heatmap displaying read-depth at the 13,778 TFAP2 ChIP-seq ‘peaks’ (y-axis) relative to non-immunoprecipitated input. (C) Hollow pie chart summarizing the distribution of TFAP2 ‘peaks’ throughout the genome, relative to key features (e.g. promoters, introns, etc.). The TFAP2 motif, along with the significance of its enrichment in all TFAP2 ‘peaks’, is displayed in the center. (D) Box-and-whisker graph plotting the FPKM values of 15,842 genes expressed in the E11.5 frontonasal prominence (FNP) mesenchyme (Hooper et al., 2020), with or without an associated TFAP2 peak (*P=2.60e-256, unpaired Wilcoxon test). (E) Density heatmaps for anti-H3K4me2 (blue), anti-H3K27ac (green), ATAC-seq (forest green) and anti-H3K27me3 (red) profiles of E10.5 FNP CNCCs (Minoux et al., 2017) at the TFAP2-positive coordinates, divided by k-means clustering. (F) Box-and-whisker graph, as in D, but with further partitioning the ‘peak’ group based on k-means clusters from E. Boxes represent the 1st and 3rd quartiles; whiskers represent the spread of values, excluding outliers (i.e. within 1.5× of the inter-quartile range). (G) GREAT (McLean et al., 2010) pathway analysis of genes associated with cluster 5. ‘Human Phenotype’ terms are listed, with craniofacial-specific terms in darker boxes. (H) IGV browser views of the Alx1, Alx3 and Alx4 loci overlaid with the epigenome signatures (blue, H3K4me2; green, H3K27ac; khaki, ATAC; red, H3K27me3) of E10.5 CNCCs residing in the mandibular prominence (MdP, top four tracks) and FNP (tracks 5-8), as well as the cluster 5-assigned TFAP2 peaks (bottom, gray highlights).

Gene expression and epistasis studies indicate zebrafish alx3 is genetically downstream of tfap2a. (A-B″) Frontal views of zebrafish embryos at 48 h post-fertilization (hpf). alx3 in situ HCR (magenta, A,B), fli1a:EGFP-labelled cranial neural crest cells (green, A′,B′) or the merge (A″,B″) in a control (A-A″) and a tfap2a−/− (B-B″) sibling. Schematics summarizing expression patterns observed for alx3 are shown on the far right, n=5 per genotype. Boxes in A and B show regions used for quantification in C. (C) Quantification of HCR signal in distinct domains of the larval head, as indicated by boxed regions in the schematic. (D-G) Whole-mount, lateral views of Alizarin Red/Alcian Blue stained skeletal preparations of 6-day-old zebrafish heads, with indicated genotypes. The anterior is towards the left. (D′-G′) Neurocrania were dissected and flat mounted. Red arrowheads indicate ectopic cartilage near the eye socket. Black arrowheads mark dorsally projecting ectopic ethmoid plate cartilage. (H-J) Tables summarizing penetrance, sample sizes and statistics of the epistasis experiments as follows: (H) the removal of wild-type alx3 copies from tfap2a homozygous mutants; (I) removal of wild-type tfap2a copies from alx3 homozygous mutants; (J) removal of wild-type tfap2a copies from alx3 heterozygotes. Boxed values correspond to the genotypes shown in E, F′ and G. Yellow, tfap2a mutant phenotypes and their penetrance (corresponding to E, E′, G′); green, removal of both alx3 copies in tfap2a-mutant backgrounds (corresponding to G, G′); purple, alx3 mutants (F′). Asterisks indicate significant difference (P<0.05) compared with the far-left column and carets indicate significant difference (P<0.05) compared with middle column (Fisher's exact test). Scale bars: 100 µm. m, mouth; n, nares; ND, not determined; ps, parasphenoid.

Acknowledgments
This image is the copyrighted work of the attributed author or publisher, and ZFIN has permission only to display this image to its users. Additional permissions should be obtained from the applicable author or publisher of the image. Full text @ Development