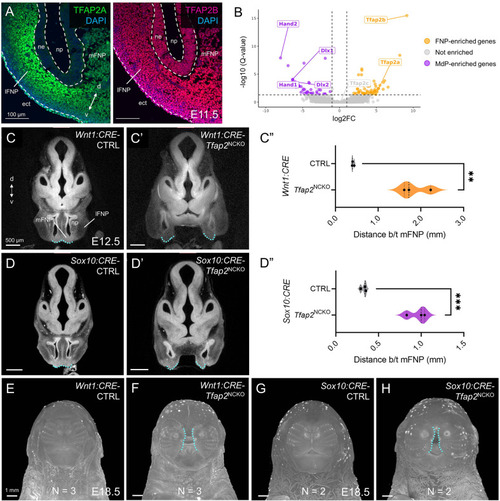
A prominent role for TFAP2A and TFAP2B in post-migratory midfacial CNCCs. (A) E11.5 wild-type midface tissue sections (horizontal angle) showing immunofluorescence of TFAP2A (left) and TFAP2B (right). White dashed lines indicate the ectoderm-mesenchyme boundaries. (B) Volcano plot displaying differentially expressed genes between E11.5 CNCCs occupying the mandibular prominence (MdP, purple) or frontonasal prominence (FNP, gold). (C-D″) Micro-computed tomography sections of E12.5 control-Tfap2NCKO littermate pairs in Wnt1:CRE (C-C′) and Sox10:CRE (D-D′) schemes. Blue dashed lines outline the medial domains of the FNP (mFNP), with the distance between them quantified and visualized as violin plots in C″ and D″. n=3 per genotype. Unpaired Student's t-test, **P<0.01, ***P<0.001. (E-H) Front view of micro-computed tomography-scanned E18.5 embryos, with indicated genotypes and sample sizes. Blue dashed lines highlight the midfacial cleft. d, dorsal; ect, ectoderm; lFNP, lateral FNP; ne, nasal epithelium; np, nasal pit; v, ventral.
|
