FIGURE SUMMARY
Title

Automated, high-throughput quantification of EGFP-expressing neutrophils in zebrafish by machine learning and a highly-parallelized microscope

Authors
Efromson, J., Ferrero, G., Bègue, A., Doman, T.J.J., Dugo, C., Barker, A., Saliu, V., Reamey, P., Kim, K., Harfouche, M., Yoder, J.A.
Source
Full text @ PLoS One

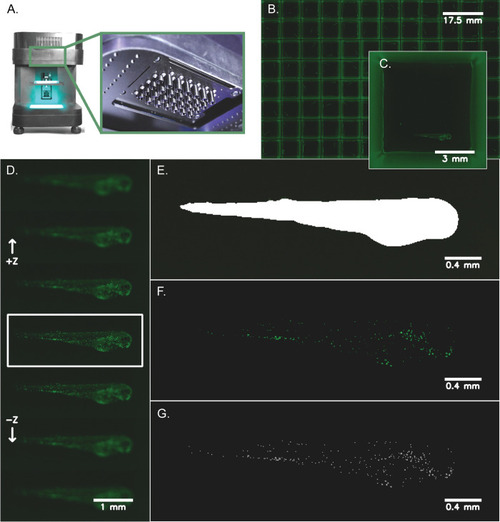
Zebrafish imaging and neutrophil quantification workflow.

Transgenic zebrafish larvae (Tg(lyz:EGFP)) expressing neutrophil-specific EGFP were anesthetized at 72 hpf and distributed into 96-well plates with low background autofluorescence and volumetrically scanned using a MCAM™ (see Materials and Methods). A) Depicts the Multi-Camera Array Microscope (MCAM™) alongside a closeup of the 48 micro camera modules that make up the microscope array. Each lens is 12 mm in diameter. B) A representative image of a 96-well plate with Tg(lyz:EGFP) transgenic zebrafish larvae is shown. C) A zoomed in image (natively 3072 x 3072 x 3 pixels2 and ~3 μm/pixel resolution) of a single well with a zebrafish larva in lateral orientation is shown. D) Following image acquisition, the Z-axis was searched automatically for the most in-focus frame of each well using a pretrained segmentation model to find a region-of-interest around each zebrafish and compute the best focus of this image region. E) Using the most in-focus frame for each well, each larva was segmented from the image background and a mask was generated to represent this region-of-interest. F) Neutrophils are shown after applying a pixel intensity threshold applied to the segmented larva which highlights the cells for counting. G) Individual cells were counted using blob detection techniques and are pinpointed on each image for visualization.

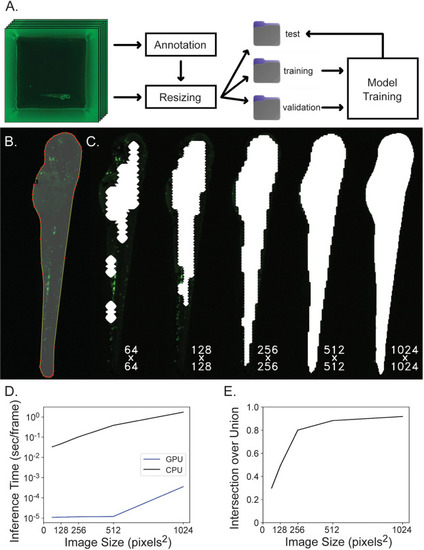
Segmentation network training and evaluation.

A) Data is organized for model training by annotating images, resizing images and corresponding annotations to model input dimensions, separating images randomly into training, validation and test subsets and then the training and validation subsets are used for model training while the test subset is used for model evaluation. B) Images are annotated by outlining the fish and many of these image-label pairs are fed to U-Net to train the neural network. C) Square 3072 x 3072 well images are downsampled to either 64 x 64, 128 x 128, 256 x 256, 512 x 512, or 1024 x 1024 pixels2 to reduce computation for segmentation inference and the resulting ROI mask is upsampled back to the original image shape which greatly affects segmentation accuracy. Here, segmentation masks computed at different resolutions are overlaid on the original image at native resolution and cropped to display only the fish. Labels reflect the resolution downsampled to during inference. D) Inference time per frame is plotted against image size. Inference time increases when segmenting increasing image sizes, and this computation is completed much more efficiently on a GPU rather than CPU. The Y-axis is displayed on a log scale. E) Intersection over union is plotted against image size. Intersection over union improves when images are inferred at higher resolution.

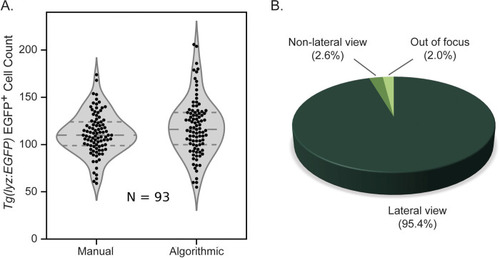
Algorithmic versus manual counting of EGFP+ neutrophils.

A) Violin plot showing similarity between distribution of manual and algorithmic neutrophil counts in 72 hpf Tg(lyz:EGFP) zebrafish expressing neutrophil-specific EGFP with highly similar mean values (N = 93 larvae). B) Orientation of anesthetized 72 hpf zebrafish (N = 192 larvae) plated in square 96-well plates suggesting that the potential discrepancy introduced by counting cells in fish in the non-lateral orientation is minimal because this sub-population accounts for such a small fraction of the whole.

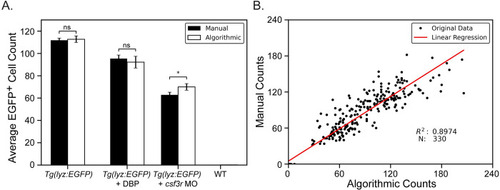
Algorithmic versus manual cell counting for experimental conditions.

A) Knockdown and chemical modulation of zebrafish neutrophil counts. A csf3r antisense morpholino (MO) was injected into one-cell stage zebrafish embryos reducing neutrophil counts at 72 hpf (N = 95 larvae). Another subset of zebrafish were treated with 2 μM dibutyl phthalate (DBP), from 6 to 72 hpf, also reducing neutrophil counts but by a more subtle degree (N = 23 larvae). Neutrophil counts were obtained manually and by using the algorithmic pipeline and compared for all groups including untreated Tg(lyz:EGFP) (N = 93 larvae) fish and non-EGFP wild-type (WT) fish (N = 96 larvae). Data points show average neutrophil count and error bars represent the standard error of each experimental group. p-values were computed using a Mann-Whitney U test. * = p ≤ 0.05, ns = no significance. B) Linear regression displaying strong correlation between manual and algorithmic counts for all conditions.

Acknowledgments
This image is the copyrighted work of the attributed author or publisher, and ZFIN has permission only to display this image to its users. Additional permissions should be obtained from the applicable author or publisher of the image. Full text @ PLoS One