
IMAGE
Fig 3
- ID
- ZDB-IMAGE-231209-3
- Publication
- Efromson et al., 2023 - Automated, high-throughput quantification of EGFP-expressing neutrophils in zebrafish by machine learning and a highly-parallelized microscope
- All Figures
- Figures for Efromson et al., 2023
Image
|
Figure Caption
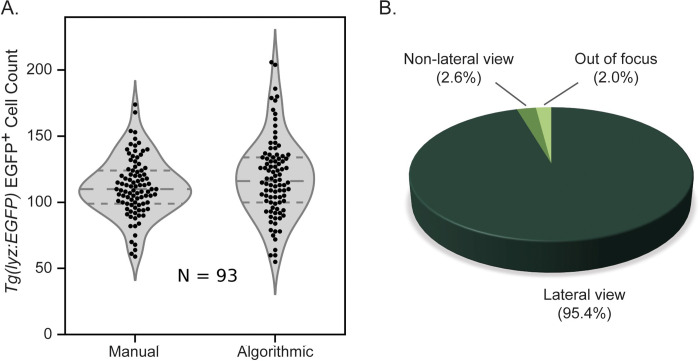
Fig 3 Algorithmic versus manual counting of EGFP+ neutrophils.
Acknowledgments
This image is the copyrighted work of the attributed author or publisher, and
ZFIN has permission only to display this image to its users.
Additional permissions should be obtained from the applicable author or publisher of the image.
Full text @ PLoS One