IMAGE

Fig 1

ID
ZDB-IMAGE-231209-1
Source
Figures for Efromson et al., 2023
Image
Figure Caption

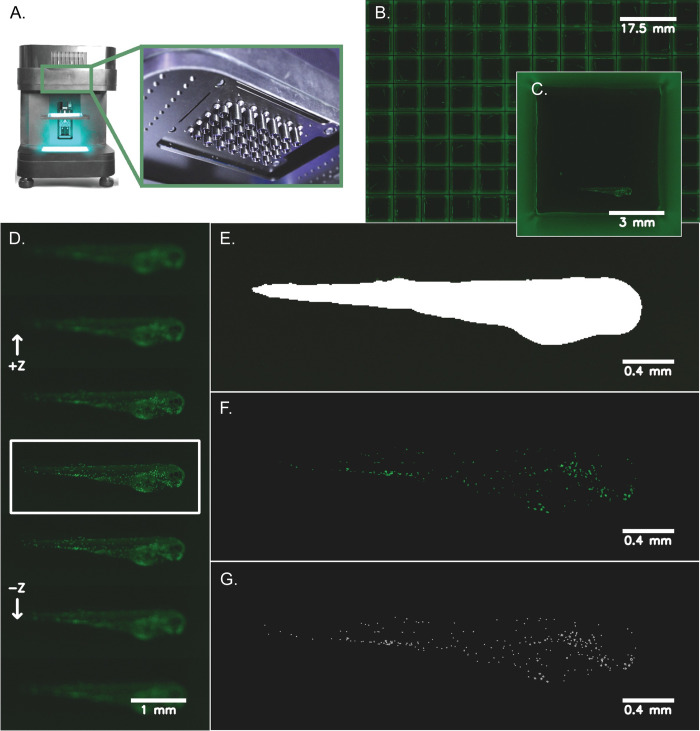
Fig 1 Zebrafish imaging and neutrophil quantification workflow.

Transgenic zebrafish larvae (Tg(lyz:EGFP)) expressing neutrophil-specific EGFP were anesthetized at 72 hpf and distributed into 96-well plates with low background autofluorescence and volumetrically scanned using a MCAM™ (see Materials and Methods). A) Depicts the Multi-Camera Array Microscope (MCAM™) alongside a closeup of the 48 micro camera modules that make up the microscope array. Each lens is 12 mm in diameter. B) A representative image of a 96-well plate with Tg(lyz:EGFP) transgenic zebrafish larvae is shown. C) A zoomed in image (natively 3072 x 3072 x 3 pixels2 and ~3 μm/pixel resolution) of a single well with a zebrafish larva in lateral orientation is shown. D) Following image acquisition, the Z-axis was searched automatically for the most in-focus frame of each well using a pretrained segmentation model to find a region-of-interest around each zebrafish and compute the best focus of this image region. E) Using the most in-focus frame for each well, each larva was segmented from the image background and a mask was generated to represent this region-of-interest. F) Neutrophils are shown after applying a pixel intensity threshold applied to the segmented larva which highlights the cells for counting. G) Individual cells were counted using blob detection techniques and are pinpointed on each image for visualization.

Acknowledgments
This image is the copyrighted work of the attributed author or publisher, and ZFIN has permission only to display this image to its users. Additional permissions should be obtained from the applicable author or publisher of the image. Full text @ PLoS One