|
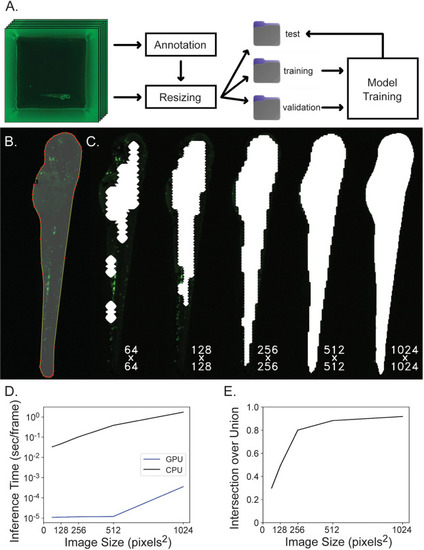
Segmentation network training and evaluation. A) Data is organized for model training by annotating images, resizing images and corresponding annotations to model input dimensions, separating images randomly into training, validation and test subsets and then the training and validation subsets are used for model training while the test subset is used for model evaluation. B) Images are annotated by outlining the fish and many of these image-label pairs are fed to U-Net to train the neural network. C) Square 3072 x 3072 well images are downsampled to either 64 x 64, 128 x 128, 256 x 256, 512 x 512, or 1024 x 1024 pixels2 to reduce computation for segmentation inference and the resulting ROI mask is upsampled back to the original image shape which greatly affects segmentation accuracy. Here, segmentation masks computed at different resolutions are overlaid on the original image at native resolution and cropped to display only the fish. Labels reflect the resolution downsampled to during inference. D) Inference time per frame is plotted against image size. Inference time increases when segmenting increasing image sizes, and this computation is completed much more efficiently on a GPU rather than CPU. The Y-axis is displayed on a log scale. E) Intersection over union is plotted against image size. Intersection over union improves when images are inferred at higher resolution.
|