
- Title
-
Impaired glycine neurotransmission causes adolescent idiopathic scoliosis
- Authors
- Wang, X., Yue, M., Cheung, J.P.Y., Cheung, P.W.H., Fan, Y., Wu, M., Wang, X., Zhao, S., Khanshour, A.M., Rios, J.J., Chen, Z., Wang, X., Tu, W., Chan, D., Yuan, Q., Qin, D., Qiu, G., Wu, Z., Zhang, J., Ikegawa, S., Wu, N., Wise, C.A., Hu, Y., Luk, K.D.K., Song, Y.Q., Gao, B.
- Source
- Full text @ Journal of Clin. Invest.
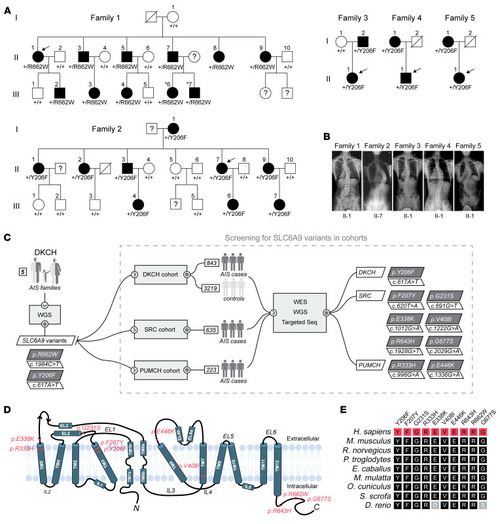
Heterozygous missense variants in ( |
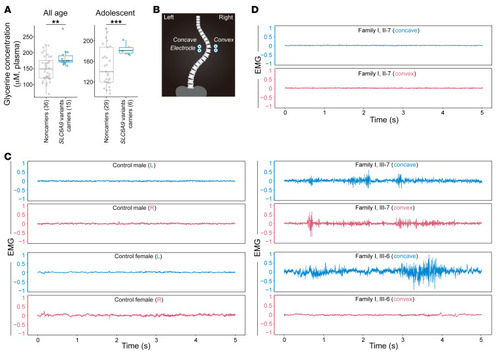
Plasma glycine concentration and paraspinal muscle activity in ( |
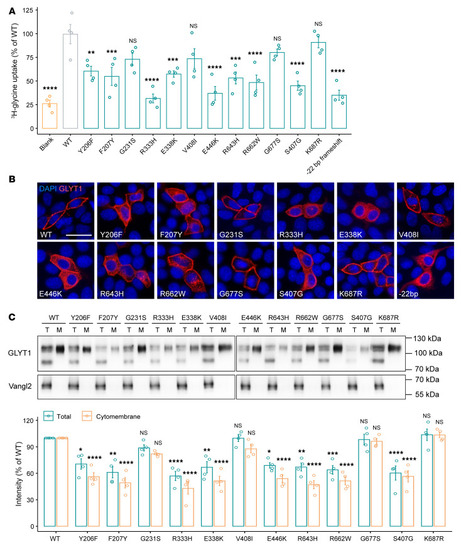
Effect of GLYT1 variants on glycine uptake and membrane presentation. ( |
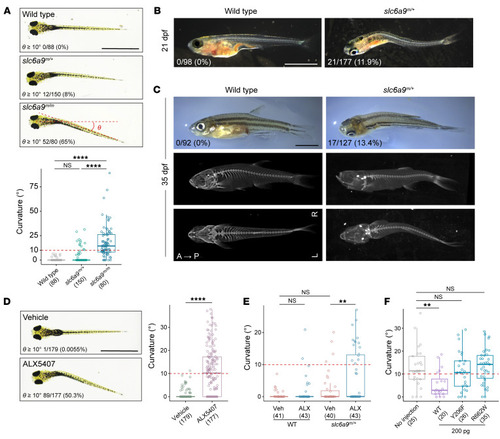
Body curvature in ( PHENOTYPE:
|
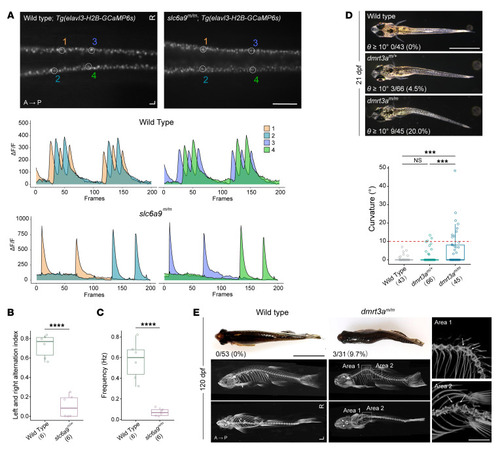
Body curvature caused by disturbance of CPG. ( |
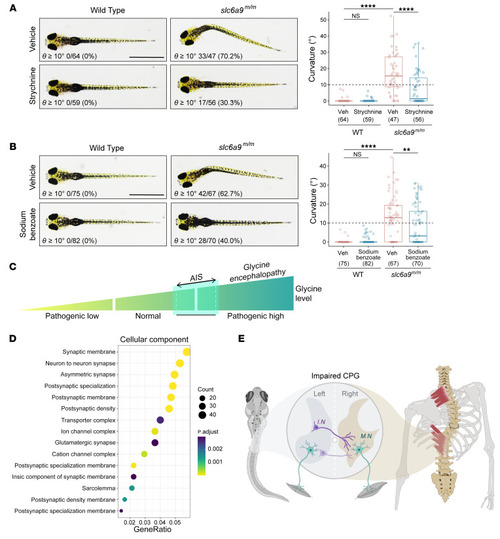
Prevention of body curvature in ( PHENOTYPE:
|