|
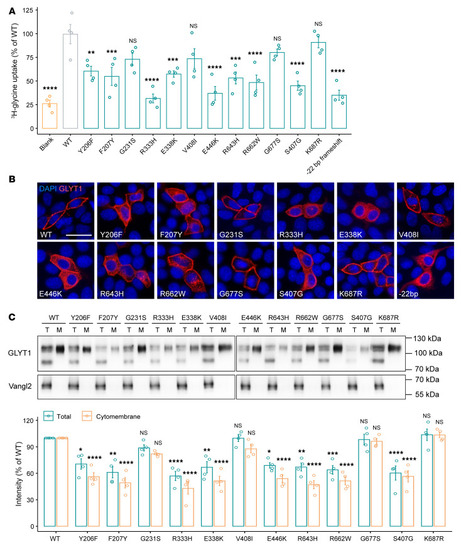
Effect of GLYT1 variants on glycine uptake and membrane presentation. (A) Results of glycine-uptake assay for GLYT1 in HEK293T cells. Each dot represents 1 independent experiment (n = 4). Error bars represent 95% CIs. Data are represented as means ± SEM. One-way ANOVA test. **P < 0.01; ***P < 0.001; ****P < 0.0001. (B) Subcellular localization of Flag-tagged GLYT1 in MDCK cells. Signals were visualized with anti-Flag antibody (red), and nuclei were stained with DAPI (blue). Scale bar: 20 μm. (C) Western blot analysis of Flag-tagged GLYT1 in total cell lysates (T) and biotinylated membrane fractions (M) of transfected HEK293T cells. Lower and higher bands indicate underglycosylated and glycosylated GLYT1, respectively. Expression of an unrelated membrane protein, HA-tagged Vangl2, served as internal transfection control. Quantification of immunoblots of total cell extracts and cytomembrane fractions of GLYT1 variants, normalized to Vangl2 and GLYT1 WT, is shown below. Each data dot represents 1 independent experiment (n = 4). Data are represented as means ± SEM. Two-way ANOVA test. *P < 0.05; **P < 0.01; ***P < 0.001; ****P < 0.0001.
|