|
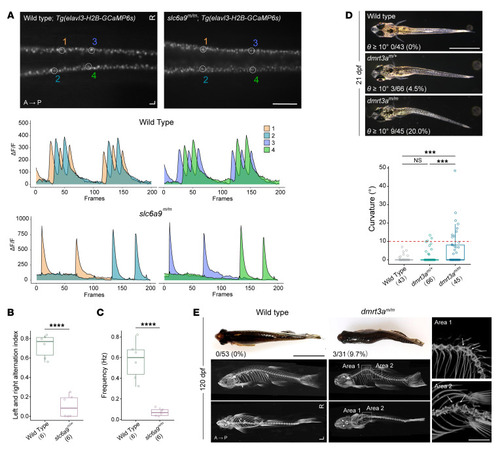
Body curvature caused by disturbance of CPG. (A) Dorsal view fluorescent snapshots of the spinal cord of WT and slc6a9m/m zebrafish in a Tg(elavl3-H2B-GCaMP6s) background at 24 hpf. ROI is circled and numbered as 1–4. Lower panel shows quantification of fluorescence changes in the ROIs of WT and slc6a9m/m zebrafish. Each frame was taken with a 100 ms exposure and at 10 fps. GCaMP6s fluorescence intensity was defined as the ΔF/F, and ΔF/F changes within a 20-second recording time are shown. (B) Quantification of left and right alternation index in WT (n = 6) and slc6a9m/m (n = 6) zebrafish. This analysis was performed based on quantified intensities of total left- and right-side neural activities within a 1-minute recording time period. Unpaired Student’s t test. ****P < 0.0001. (C) Frequency of neural activities in WT (n = 6) and slc6a9m/m (n = 6) zebrafish. Frequency (Hz) was calculated based on left-side neural activity. Unpaired Student’s t test. ****P < 0.0001. (D) Spinal curvature of dmrt3a mutant zebrafish at 21 dpf. (E) Curvature phenotype and micro-CT images of dmrt3a mutant zebrafish at 120 dpf. Images are shown in either side or dorsal view. To detect the details of apices of curvatures, the 2 curvature regions (areas 1 and 2) of dmrt3am/m zebrafish are enlarged and oriented in different angles (right). Note that all highlighted adjacent vertebrae (arrows) are morphologically normal. Scale bars: 200 μm (A); 2 mm (D, E, right); 1 cm (E, left). Boxes show median and IQRs with all individual data points superimposed. Number of analyzed fish and the penetrance of curvature (θ ≥10°) are quantified and indicated for each genotype. Unpaired Student’s t test (B and C) or 1-way ANOVA test (D). ***P < 0.001; ****P < 0.0001.
|