
Figure 4
- ID
- ZDB-IMAGE-240116-4
- Publication
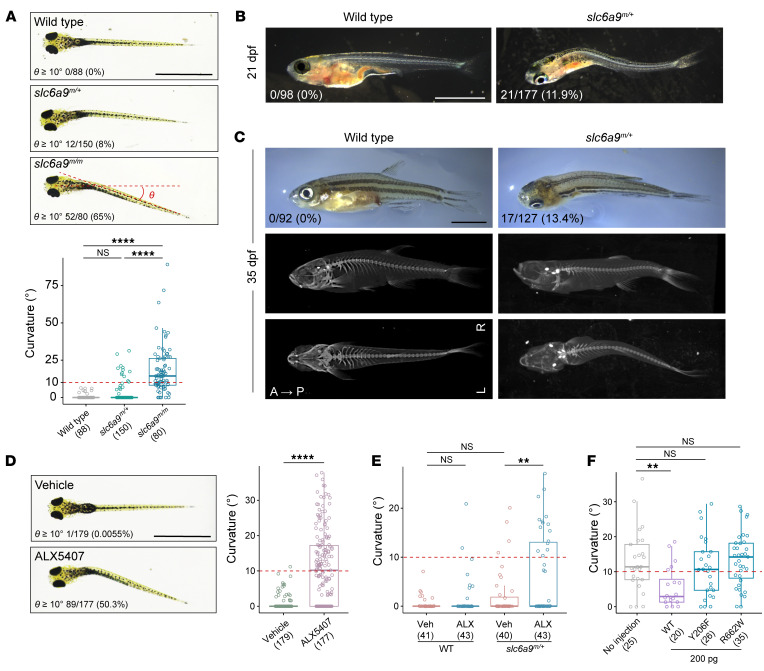
- Wang et al., 2023 - Impaired glycine neurotransmission causes adolescent idiopathic scoliosis
- All Figures
- Figures for Wang et al., 2023
|
Figure 4
Body curvature in
(