
- Title
-
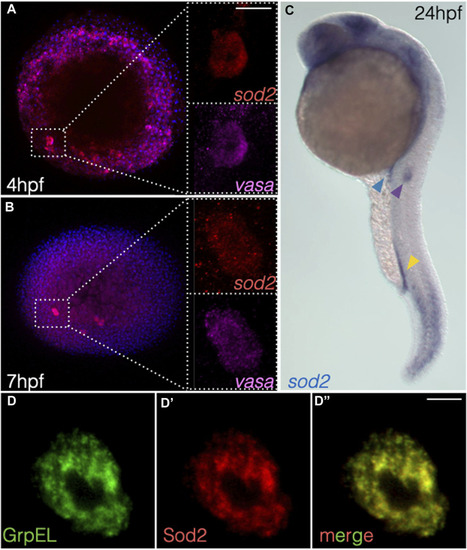
The mitochondrial protein Sod2 is important for the migration, maintenance, and fitness of germ cells
- Authors
- Tarbashevich, K., Ermlich, L., Wegner, J., Pfeiffer, J., Raz, E.
- Source
- Full text @ Front Cell Dev Biol
|
Generation of |

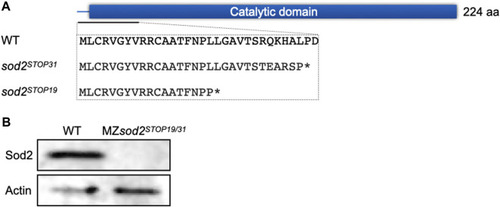
MZ |

Defects in protrusion formation and germ cell polarity in |

MZ |
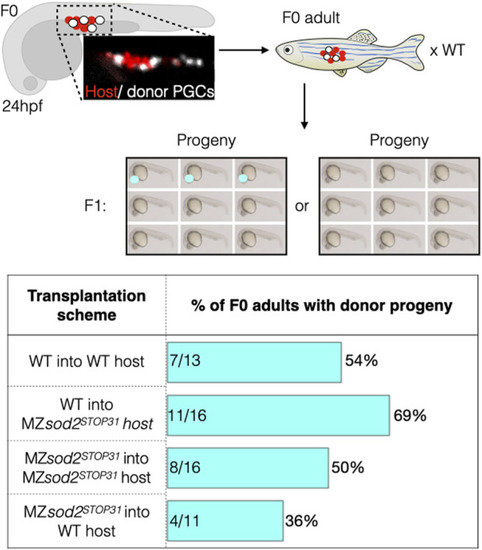
Analysis of zebrafish with mosaic gonads: PGC transplantation approach. Embryos with mosaic germ cell clusters (white cells are the transplanted donor PGCs, red cells are the host PGCs in the upper panels) were selected at 24 hpf and raised to adulthood and crossed to wild-type fish. If clutches contained embryos with the dominant marker of the donor line (red eyes), the outcrossed adult fish would be counted as “positive.” Lower graph shows the number of such positive fish relative to the total number of adults tested is presented in percentage for each background. Numbers within the bars represent the number of F0 adults with donor progeny divided by the total number of F0 adults raised for this line. |
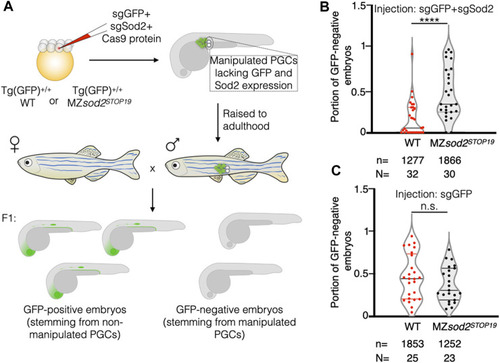
Generation and analysis of zebrafish with mosaic gonads: Cas9-based approach. |
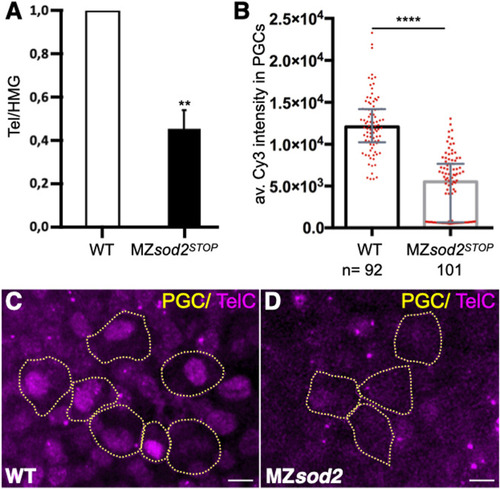
The number of telomeric repeats is reduced in |

Schematic illustration of changes in mitochondria numbers during zebrafish development. Representation of mitochondria numbers per germ cell at 8 hpf and 24 hpf of zebrafish development in WT (black) and MZ |