IMAGE

FIGURE 8

ID
ZDB-IMAGE-231114-8
Source
Figures for Tarbashevich et al., 2023
Image
Figure Caption

FIGURE 8

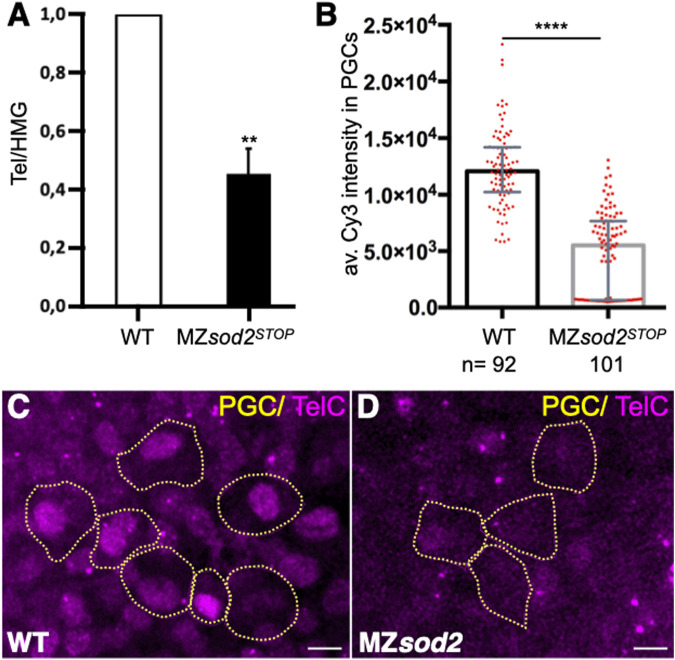
The number of telomeric repeats is reduced in sod2 KO fish lines. (A) The relative length of telomeric repeats in wild type and MZsod2 mutants was determined by qPCR (graph). The qPCR values were normalized to the WT condition. (B) The relative number of telomeric repeats was determined by fluorescence in situ hybridization (FISH) using Cy3-conjugated TelC probes. The graph presents intensity measurements of the TelC signal in individual PGC nuclei. n–number of PGCs analyzed in 32 WT and 35 MZsod2 embryos (C, D) Representative confocal images of TelC-FISH staining. PGCs are identified by the expression of EGFP-F′ on their cell membranes (represented by yellow dotted lines). ****p < 0.0001was determined by Student’s t-test. Scale bar 10 µm.

Acknowledgments
This image is the copyrighted work of the attributed author or publisher, and ZFIN has permission only to display this image to its users. Additional permissions should be obtained from the applicable author or publisher of the image. Full text @ Front Cell Dev Biol