
Image
|
Figure Caption
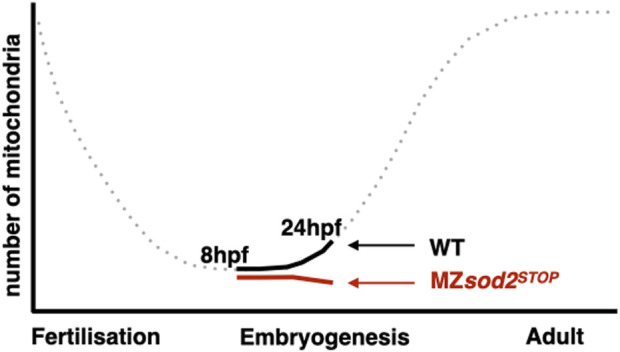
FIGURE 9
Schematic illustration of changes in mitochondria numbers during zebrafish development. Representation of mitochondria numbers per germ cell at 8 hpf and 24 hpf of zebrafish development in WT (black) and MZ
Acknowledgments
This image is the copyrighted work of the attributed author or publisher, and
ZFIN has permission only to display this image to its users.
Additional permissions should be obtained from the applicable author or publisher of the image.
Full text @ Front Cell Dev Biol