FIGURE SUMMARY
Title

Preclinical assessment of CAR-NK cell-mediated killing efficacy and pharmacokinetics in a rapid zebrafish xenograft model of metastatic breast cancer

Authors
Murali Shankar, N., Ortiz-Montero, P., Kurzyukova, A., Rackwitz, W., Künzel, S.R., Wels, W.S., Tonn, T., Knopf, F., Eitler, J.
Source
Full text @ Front Immunol

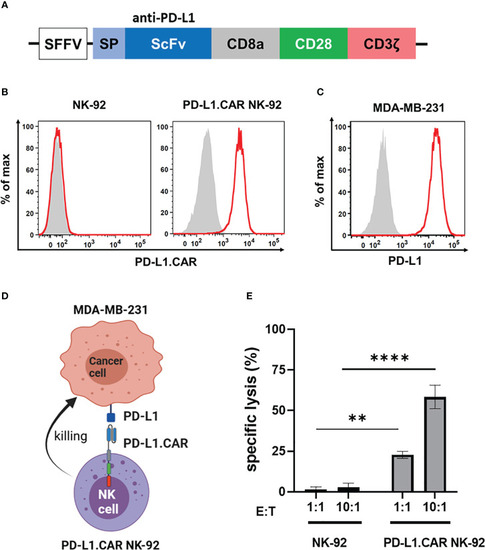
PD-L1.CAR NK-92 cells are highly cytotoxic against PD-L1+ targets in vitro. (A) Schematic representation of the PD-L1.CAR construct. A second-generation CAR under the spleen focus-forming virus (SFFV) promoter consists of PD-L1-specific scFv, CD8 hinge, CD28 transmembrane/costimulatory, and CD3ζ intracellular signaling domains. (B) Flow cytometric analysis of PD-L1.CAR expression on immunomagnetically enriched PD-L1.CAR NK-92 cells and parental NK-92 cells. PD-L1.CAR was detected using human recombinant PD-L1-Fc protein combined with anti-Fc secondary antibody. Filled gray areas indicate negative controls stained with secondary antibody only. (C) Flow cytometric analysis of PD-L1+ expression on the cell surface of MDA-MB-231 cells. Representative data from at least 3 independent experiments are shown. (D) Illustration of the NK cell and cancer cell model. NK-92 cells were lentivirally transduced with PD-L1.CAR, and the PD-L1+ metastatic breast adenocarcinoma cell line MDA-MB-231 was used as a target. Created with BioRender. (E) PD-L1.CAR NK-92 or parental NK-92 cells were co-cultured with MDA-MB-231 cells at E:T ratios of 1:1 and 10:1 for 2 hours as indicated and specific in vitro cytotoxicity was measured by Europium-based cytotoxicity assay. One-way ANOVA with Tukey’s multiple comparisons was used to calculate statistics. Data were pooled from 3 independent experiments, and means ± SEM are shown. **P<0.01; ****P<0.0001.

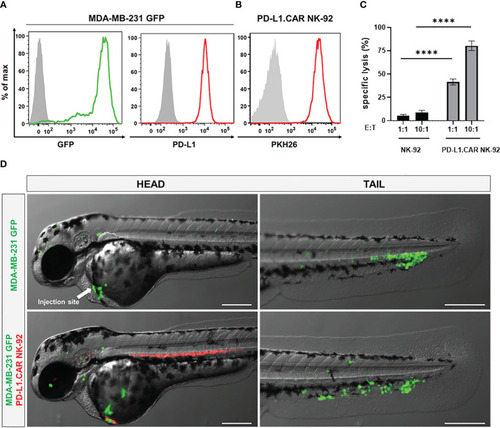
Labeled cancer and NK cells retain in vitro cytotoxicity and circulate in zebrafish larvae after injection. (A) MDA-MB-231 cells were transduced with GFP (MDA-MB-231 GFP). Expression of GFP and PD-L1 was analyzed by flow cytometry. Non-transduced and unstained cells shown in gray as negative controls for GFP and PD-L1, respectively. (B) PD-L1.CAR NK-92 cells were labeled with PKH26 and confirmed by flow cytometry. The filled gray histogram represents the unstained control. (C) PD-L1.CAR NK-92 or parental NK-92 cells were co-cultured with MDA-MB-231 GFP cells at E:T ratios of 1:1 and 10:1 for 2 hours as indicated, and specific in vitro cytotoxicity was measured by Europium-based cytotoxicity assay. Data were pooled from at least 3 independent experiments, and means ± SEM are shown. One-way ANOVA with Tukey’s multiple comparisons was used to calculate statistics. (D) MDA-MB-231 GFP cells were injected into the DoC alone (top) or injected at the same site 2.5 hours later with PD-L1.CAR NK-92 PKH26-labeled cells (bottom). Images of the head or tail region of zebrafish larvae were captured by fluorescence microscopy. Scale bar = 250 μm. Representative images are shown. ****P<0.0001. ns, not significant.

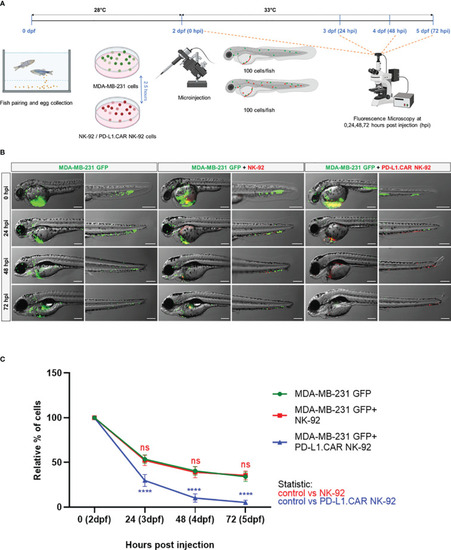
Kinetics of PD-L1.CAR NK-92 cytotoxicity in zebrafish in vivo.(A) Schematic time course of the experimental setup. Zebrafish larvae were injected with MDA-MB-231 GFP cells at 2 days post fertilization (dpf) and 2.5 hours later with PKH26-labeled PD-L1.CAR NK-92 or parental NK-92 cells. For each cell type, 100 cells were injected on average. Images were captured by fluorescence microscopy at 24, 48, and 72 hours post injection (hpi). (B) Fluorescence micrographs showing zebrafish larvae injected with MDA-MB-231 GFP cells or combinations with NK-92 or PD-L1.CAR NK-92 at the indicated time points. MDA-MB-231 GFP cells are shown in green and PKH26-labeled NK cells are shown in red. Representative images are shown. Scale bar = 250 μm. (C) Quantification of MDA-MB-231 GFP cells throughout the zebrafish at the indicated time points and plotted as relative percentage of cells at 0 hpi. Data are pooled from 2 independent experiments and shown as mean ± SEM. n=3 (MDA-MB-231 GFP, MDA-MB-231 GFP+NK-92), n=4 (MDA-MB-231 GFP+PD-L1.CAR NK-92). Two-way ANOVA analysis with Tukey’s multiple comparison was used for statistical analysis. ****P<0.0001; ns (not significant).

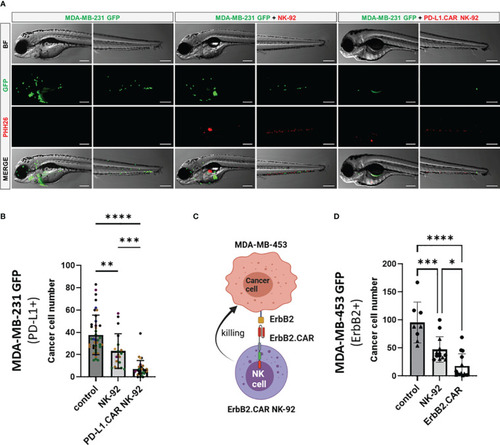
CAR NK-92 cells specific for PD-L1 or ErbB2 show high efficacy against resistant breast cancer cells in a zebrafish xenograft model. (A) Zebrafish larvae were injected at 2 dpf with MDA-MB-231 GFP cells and 2.5 hours later with PKH26-labeled PD-L1.CAR NK-92 or parental NK-92 cells. For each cell type an average 100 cells was injected. Images were captured by fluorescence microscopy at time points of 48 hpi. Scale bar = 250 μm. (B) The number of MDA-MB-231 GFP cells was quantified at 48 hpi. Data are pooled from 6 independent experiments and shown as mean ± SD. n=41 (MDA-MB-231 GFP), n=19 (MDA-MB-231 GFP+NK-92), n=31 (MDA-MB-231 GFP+PD-L1.CAR NK-92). (C) Schematic representation of ErbB2-specific CAR NK-92 (ErbB2.CAR NK-92) targeting ErbB2+ MDA-MB-453 metastatic breast cancer cell line. Illustration created with BioRender. (D) Zebrafish larvae were injected at 2 dpf with MDA-MB-453 GFP cells and 2.5 hours later with PKH26-labeled ErbB2.CAR NK-92 or parental NK-92 cells. For each cell type, 100 cells were injected on average. Images were captured by fluorescence microscopy at 8 hpi and the number of cancer cells was quantified. Data were pooled from 2 independent experiments and means ± SD are shown. n=8 (MDA-MB-453 GFP) n=13 (MDA-MB-453 GFP+NK-92), n=14 (MDA-MB-453 GFP+ErbB2.CAR NK-92). One-way ANOVA analysis with Tukey’s multiple comparison was used for statistical analysis. *p=0.0154. **P<0.01; ***P<0.001; ****P<0.0001.

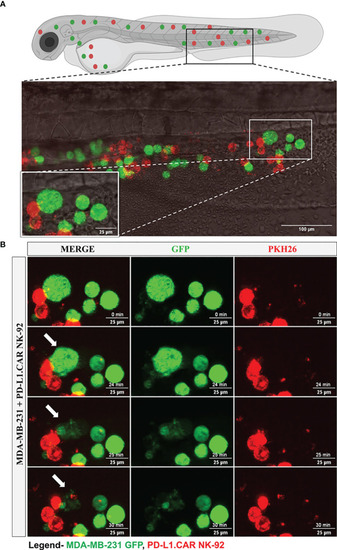
Time-lapse imaging of CAR-NK cell interaction with cancer cells and cytotoxicity in the zebrafish tail. MDA-MB-231 GFP cells and 2 hours later PD-L1.CAR NK-92 cells (PKH26-labeled) were injected into the DoC. One hour after injection, confocal microcopy images were taken in the tail region. (A) Representative picture showing the location of imaging. (B) Time-lapse images showing the interaction between NK cells (red) and cancer cells (green). The arrow indicates cancer cell killing. Scale bar = 25 μm.

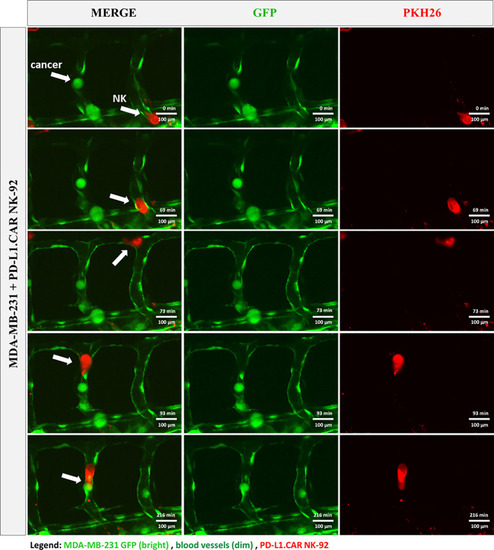
CAR-NK cells migrate to cancer cells within the vasculature. MDA-MB-231 GFP cells and PKH26-labeled PD-L1.CAR NK-92 cells were injected into transgenic Tg(flk1:GFP) zebrafish with endothelial cells expressing low levels of GFP. Confocal time-lapse microscopy shows NK cell migration to the metastatic breast cancer cell (indicated by arrows). Representative images are shown. Scale bar = 100 μm.

Acknowledgments
This image is the copyrighted work of the attributed author or publisher, and ZFIN has permission only to display this image to its users. Additional permissions should be obtained from the applicable author or publisher of the image. Full text @ Front Immunol