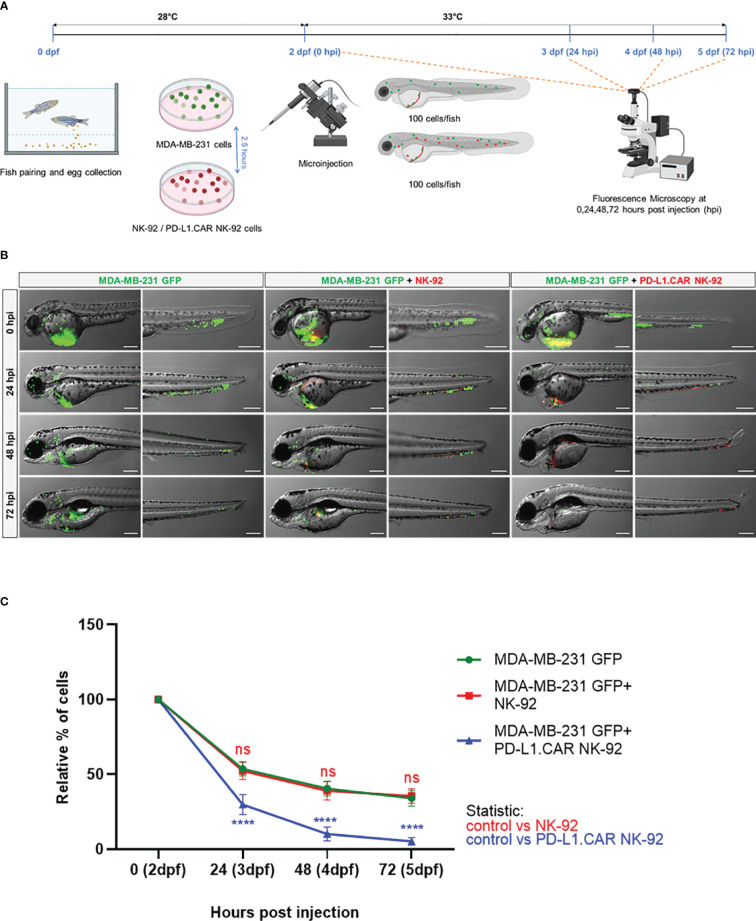
IMAGE

Figure 3

ID
ZDB-IMAGE-231027-4
Source
Figures for Murali Shankar et al., 2023
Image
Figure Caption

Figure 3

Kinetics of PD-L1.CAR NK-92 cytotoxicity in zebrafish in vivo.(A) Schematic time course of the experimental setup. Zebrafish larvae were injected with MDA-MB-231 GFP cells at 2 days post fertilization (dpf) and 2.5 hours later with PKH26-labeled PD-L1.CAR NK-92 or parental NK-92 cells. For each cell type, 100 cells were injected on average. Images were captured by fluorescence microscopy at 24, 48, and 72 hours post injection (hpi). (B) Fluorescence micrographs showing zebrafish larvae injected with MDA-MB-231 GFP cells or combinations with NK-92 or PD-L1.CAR NK-92 at the indicated time points. MDA-MB-231 GFP cells are shown in green and PKH26-labeled NK cells are shown in red. Representative images are shown. Scale bar = 250 μm. (C) Quantification of MDA-MB-231 GFP cells throughout the zebrafish at the indicated time points and plotted as relative percentage of cells at 0 hpi. Data are pooled from 2 independent experiments and shown as mean ± SEM. n=3 (MDA-MB-231 GFP, MDA-MB-231 GFP+NK-92), n=4 (MDA-MB-231 GFP+PD-L1.CAR NK-92). Two-way ANOVA analysis with Tukey’s multiple comparison was used for statistical analysis. ****P<0.0001; ns (not significant).

Acknowledgments
This image is the copyrighted work of the attributed author or publisher, and ZFIN has permission only to display this image to its users. Additional permissions should be obtained from the applicable author or publisher of the image. Full text @ Front Immunol