
- Title
-
cxcl12a plays an essential role in pharyngeal cartilage development
- Authors
- Wei, Z., Hong, Q., Ding, Z., Liu, J.
- Source
- Full text @ Front Cell Dev Biol
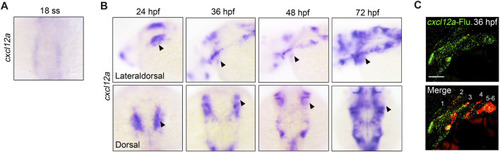
Expression of |
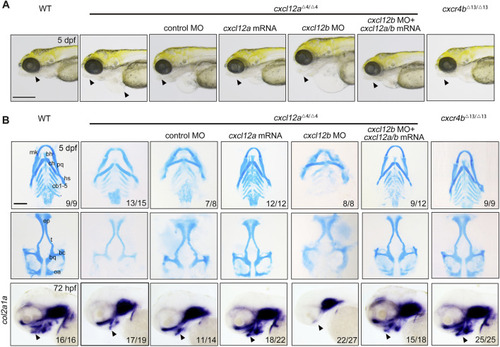
Depletion of cxcl12a impairs craniofacial cartilage development. |
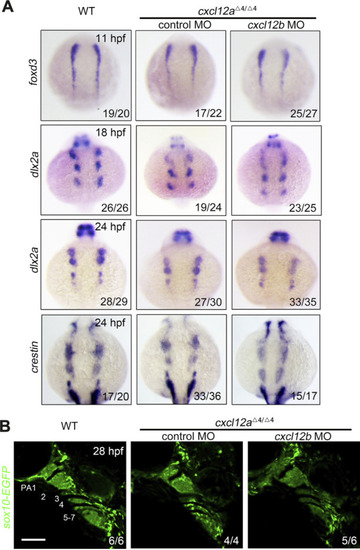
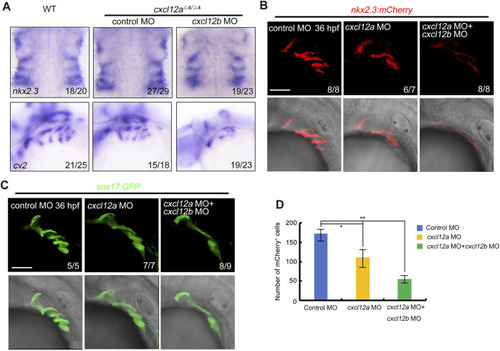
NCC specification and migration. |

|
|