
- Title
-
Combined western diet and bisphenol A exposure induces an oxidative stress-based paraoxonase 1 response in larval zebrafish
- Authors
- van den Boom, R., Vergauwen, L., Koedijk, N., da Silva, K.M., Covaci, A., Knapen, D.
- Source
- Full text @ Comp. Biochem. Physiol. C Toxicol. Pharmacol.
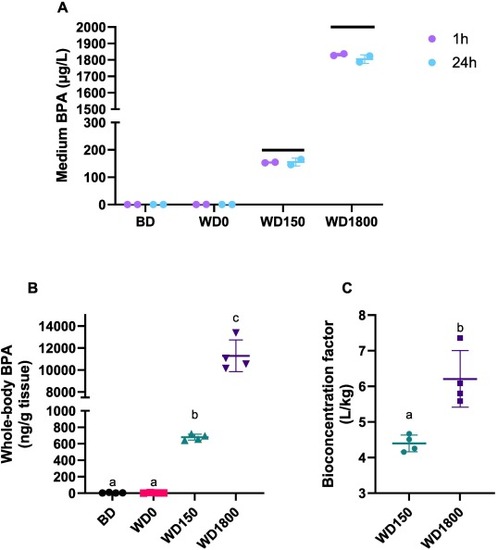
BPA measurements in medium and whole-body homogenate and resulting bioconcentration factor. Data represent the mean ± SD of BPA concentration in medium 1 h and 24 h after renewal (A, n = 2, 15 and 18 dpf), concentration of BPA in whole-body homogenates at the end of the exposure (19 dpf) (B, n = 4) and bioconcentration factors (C, n = 4). Colored lines in (A) indicate nominal exposure concentrations. BD: balanced diet, WD: western diet. 0, 150, and 1800 indicate BPA concentration in μg/L. |
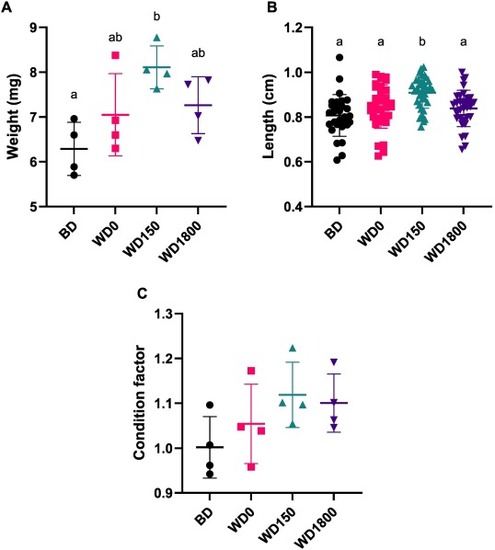
Weight, length and condition factors. Data represent the mean ± SD of larval weights (A, n = 4), lengths (B, n = 36) and condition factors (C, n = 4) of each group at the end of the exposure (19 dpf). Different letters indicate a statistically significant difference based on the ANOVA post hoc analyses with Tukey's multiple comparisons test. BD: balanced diet, WD: western diet. 0, 150, and 1800 indicate BPA concentration in μg/L. |
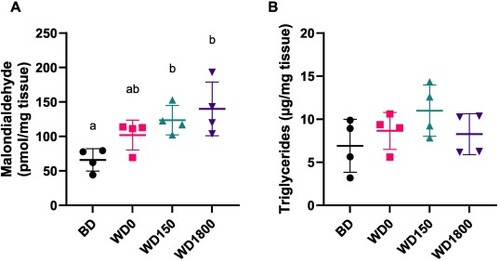
Whole-body malondialdehyde (MDA) and triglyceride content at the end of the exposure (19 dpf). Data represent the mean ± SD of MDA (A, n = 4) and triglyceride levels (B, n = 4). Different letters indicate a statistically significant difference based on the ANOVA post hoc analyses with Tukey's multiple comparisons test. BD: balanced diet, WD: western diet. 0, 150, and 1800 indicate BPA concentration in μg/L. |
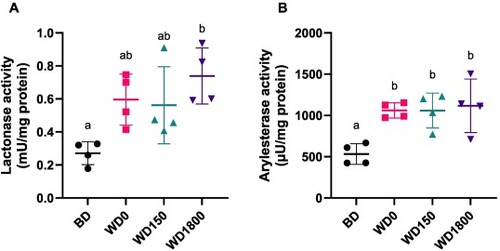
Whole-body PON1 LACase and AREase activities at the end of the exposure period (19 dpf). Data represent the mean ± SD of LACase (A, n = 4) and AREase (B, n = 4) activities. Different letters indicate a statistically significant difference based on the ANOVA post hoc analyses with Tukey's multiple comparisons test. BD: balanced diet, WD: western diet. 0, 150, and 1800 indicate BPA concentration in μg/L. |
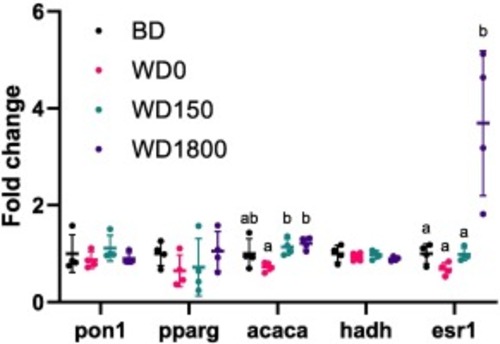
Transcript levels of pon1, esr1 and genes involved in lipid metabolism. Data represent the mean ± SD of paraoxonase 1 (pon1), peroxisome proliferator-activated receptor gamma (pparg), acetyl-CoA carboxylase (acaca), hydroxyacyl-coA dehydrogenase (hadh) and estrogen receptor 1 (esr1) fold change normalized to the BD group. Different letters indicate a significant difference based on the ANOVA post hoc analyses with Tukey's multiple comparisons test. BD: balanced diet, WD: western diet. 0, 150, and 1800 indicate BPA concentration in μg/L. |
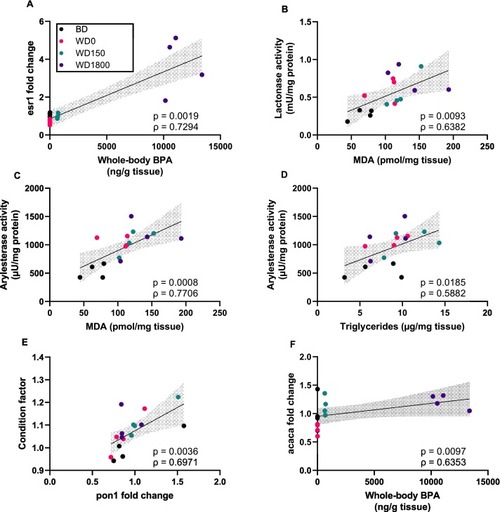
Significant correlations between pairs of endpoints. Each datapoint represents the (average) measurement of one replicate. Black lines show simple linear regressions and gray area shows 95 % confidence interval. (A) Correlation of tissue BPA concentration and esr1 transcription. (B) Correlation of PON1 LACase activity and MDA levels. The BD group datapoints are mostly concealed beneath the WD0 datapoints. (C) Correlation of PON1 AREase activity and MDA levels. (D) Correlation of PON1 AREase activity and triglyceride content. (E) Correlation of condition factor and pon1 mRNA expression. (F) Correlation of tissue BPA concentration and acaca transcription. BD: balanced diet, WD: western diet. 0, 150, and 1800 indicate BPA concentration in μg/L. |
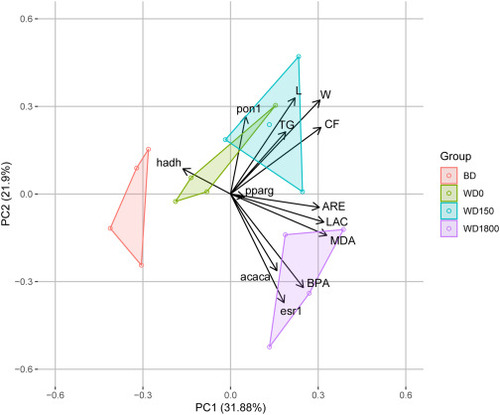
Principal component analysis. Biological replicates are shown as separate dots in the PCA. Different endpoints are shown as arrows, including weight (W), length (L), condition factor (CF), whole-body BPA concentration (BPA), MDA levels (MDA), triglyceride levels (TG), LACase activity (LAC), AREase activity (ARE) and mRNA expression of the measured genes. BD: balanced diet, WD: western diet. 0, 150, and 1800 indicate BPA concentration in μg/L. |
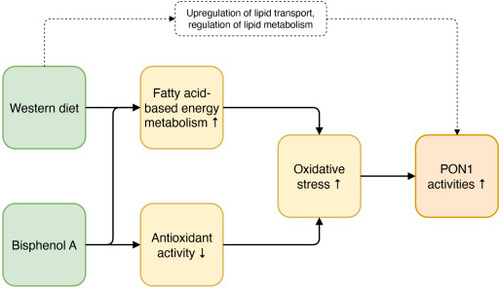
Hypothesized mechanisms linking western diet and BPA exposure to oxidative stress and PON1 activity changes based on the observations in this study and supported by mechanistic knowledge from existing literature (Rani et al., 2016; Tan et al., 2018; Gassman, 2017). The western diet likely caused a metabolic shift towards a fatty acid-based energy metabolism, which was increased by BPA exposure. The increased fatty acid-based energy metabolism caused increased oxidative stress. Additionally, BPA independently contributed to oxidative stress by lowering antioxidant activity and producing reactive oxygen species. The increased oxidative stress likely triggered the increased PON1 activity as an antioxidant response. Although we have not direct evidence for a link with lipid transport, PON1 is known to be associated to lipid transport through HDL and is influenced by regulators of lipid metabolism. These factors are therefore also likely to contribute to the PON1 response caused by the western diet (Blatter Garin et al., 2006; Camps et al., 2012; Escolà-Gil et al., 2011). |

|