
Image
|
Figure Caption
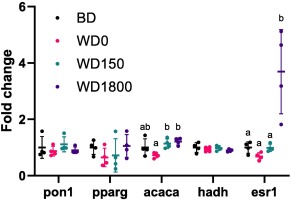
Fig. 5 Transcript levels of pon1, esr1 and genes involved in lipid metabolism. Data represent the mean ± SD of paraoxonase 1 (pon1), peroxisome proliferator-activated receptor gamma (pparg), acetyl-CoA carboxylase (acaca), hydroxyacyl-coA dehydrogenase (hadh) and estrogen receptor 1 (esr1) fold change normalized to the BD group. Different letters indicate a significant difference based on the ANOVA post hoc analyses with Tukey's multiple comparisons test. BD: balanced diet, WD: western diet. 0, 150, and 1800 indicate BPA concentration in μg/L.
Acknowledgments
This image is the copyrighted work of the attributed author or publisher, and
ZFIN has permission only to display this image to its users.
Additional permissions should be obtained from the applicable author or publisher of the image.
Full text @ Comp. Biochem. Physiol. C Toxicol. Pharmacol.