
Image
|
Figure Caption
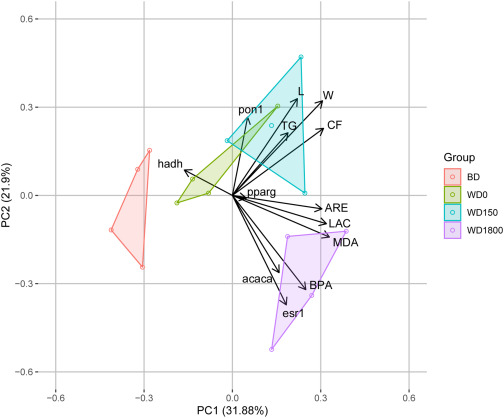
Fig. 7 Principal component analysis. Biological replicates are shown as separate dots in the PCA. Different endpoints are shown as arrows, including weight (W), length (L), condition factor (CF), whole-body BPA concentration (BPA), MDA levels (MDA), triglyceride levels (TG), LACase activity (LAC), AREase activity (ARE) and mRNA expression of the measured genes. BD: balanced diet, WD: western diet. 0, 150, and 1800 indicate BPA concentration in μg/L.
Acknowledgments
This image is the copyrighted work of the attributed author or publisher, and
ZFIN has permission only to display this image to its users.
Additional permissions should be obtained from the applicable author or publisher of the image.
Full text @ Comp. Biochem. Physiol. C Toxicol. Pharmacol.