
Image
|
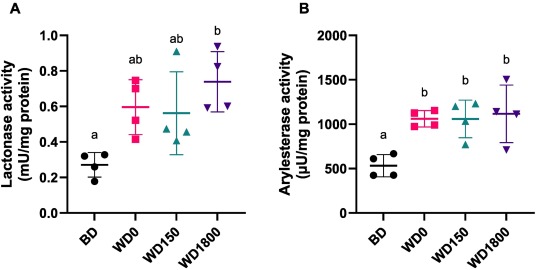
Figure Caption
Fig. 4 Whole-body PON1 LACase and AREase activities at the end of the exposure period (19 dpf). Data represent the mean ± SD of LACase (A, n = 4) and AREase (B, n = 4) activities. Different letters indicate a statistically significant difference based on the ANOVA post hoc analyses with Tukey's multiple comparisons test. BD: balanced diet, WD: western diet. 0, 150, and 1800 indicate BPA concentration in μg/L.
Acknowledgments
This image is the copyrighted work of the attributed author or publisher, and
ZFIN has permission only to display this image to its users.
Additional permissions should be obtained from the applicable author or publisher of the image.
Full text @ Comp. Biochem. Physiol. C Toxicol. Pharmacol.