
- Title
-
Apical size and deltaA expression predict adult neural stem cell decisions along lineage progression
- Authors
- Mancini, L., Guirao, B., Ortica, S., Labusch, M., Cheysson, F., Bonnet, V., Phan, M.S., Herbert, S., Mahou, P., Menant, E., Bedu, S., Tinevez, J.Y., Baroud, C., Beaurepaire, E., Bellaiche, Y., Bally-Cuif, L., Dray, N.
- Source
- Full text @ Sci Adv

Apical area correlates with cellular types and states in the germinal zone of the adult zebrafish pallium. (A and B) High magnification of a 3-mpf Tg(gfap:eGFP) whole-mount pallium processed for IHC for GFP (green), PCNA (magenta), and ZO1 (white). Arrowheads to qNSCs (GFP+, green), aNSCs (GFP+ PCNA+, magenta), and aNPs (PCNA+, orange). (A) Dorsal view. ZO1 reveals the apical area (AA) of each cell and the cellular topology of the tissue. (B) Optical section perpendicular to the pallial ventricular zone, passing, from left to right, through a qNSC, an aNSCs, and a cluster of two aNPs. Double-headed white arrow to the direction of the dorsoventral axis, double headed yellow arrows to the main axis of elongation of the nucleus in an aNSC and an aNP. Scale bars, 10 μm. (C) Top: Photographs of whole-mount pallia (dorsal views, Dm); bottom: corresponding segmented views (green circle: cell vertex). Left: Segmentation of AA based on ZO1 (blue number: cell ID used for subsequent analysis). Middle: Segmented regions with detected marker, here PCNA (manually corrected segmentation to avoid false-positive cells). Right: High magnification of a preparation stained for the markers of interest with the corresponding final segmentation and cell identities (color coded). (D) Distribution of AAs of qNSCs, aNSCs, and aNPs in Dm for four brains pooled. Red dashed lines: median. (E) Maximum projection of a dorsal view of a whole-mount IHC in a 3-mpf Tg(deltaA:eGFP);Tg(gfap:dtTOMATO) fish labeled for dTomato (green), ZO1 (green), eGFP (cyan), and PCNA (magenta). Arrowheads to a deltaApos aNSC (white) and deltaAneg aNSC (yellow). Scale bars, 10 μm. (F) Proportion of deltaApos cells (cyan) within the indicated cell types (n = 4 independent hemispheres, Dm). (G) Distribution of AAs in qNSCs and aNSC singlets according to deltaA expression. Red dashed line: median (n = 4 independent hemispheres, Dm). Statistics: Nonparametric t test (Mann-Whitney test), P < 0.0001. |

Apical area dynamics in NSCs. (A) 3D dorsal view of the pallial surface in a 2.5-mpf casper;Tg(deltaA:eGFP);Tg(gfap:hZO1-mKate2) fish imaged intravitally using biphoton multicolor microscopy. deltaA:eGFP: deltaA transcription, cyan; gfap:ZO1-mKate2: NSC apical contours, yellow. Arrows show the anteroposterior (A-P) and mediolateral (M-L) axes. Scale bar, 30 μm. (B) Schematic example of a dividing track (horizontal tree) (horizontal arrow: time; vertical bars: imaging tp, consecutive tps separated by 2 to 3 days), to position a mother NSC (MC, blue arrow, example picture), daughter NSCs (DCs, cytokinesis event, green arrow), and DC+1 at the next tp (pink arrow, example picture). DC is the first tp where two daughters can be identified. We only scored dividing tracks where MC was preceded by at least 4 to 5 days without division (black part of time arrow). Track interruption before the end of the recording period corresponds to a delamination (example in orange). Scale bars, 10 μm. (C) 3D maximum projection with split and merged channels of the first tp of a time lapse. Color code for the overlay of middle image: NSCs that will divide (purple, tp of division), cells that will delaminate (orange, tp of delamination). The apparent spreading of deltaA:GFP (magenta) into neighboring cells results from their body ballooning beyond their apical surface (movie S1). (D) AA distribution of all MCs and all their DCs. Red dashed line: median (n = 4 independent hemispheres, Dm), 102 μm2 for MCs and 45 μm2 for DCs (P < 0.0001, Mann-Whitney). (E) Normalized AA of qNSCs during nondivision phases relative to time and deltaA expression (deltaAneg NSCs: gray, deltaApos NSCs: blue) (with median and 95% CI). (F) Normalized area of the entire region of interest (ROI) over time (green) versus normalized AA of deltaAneg qNSCs during nondivision phases [gray, as in (E)] (with median and 95% CI). |

The behavior of deltaApos NSCs is biased toward proliferation and differentiation. (A) Distribution of AA in qNSCs (measurements on the last tp of each time lapse) and aNSCs (measurements of MCs) according to deltaA expression (n = 4 independent fish pooled). Red dashed line: median. Statistics: Nonparametric t test between both distributions (Mann-Whitney test, two-tailed), P < 0.0001. (B) Percentages of deltaApos versus deltaAneg NSC tracks where a post-quiescence division event takes place during a whole movie (n = 4 fish, median with 95% CI). (C) Percentages of delamination events occurring in deltaApos MCs versus deltaAneg MCs (n = 4 fish, error bars for SEM). (D) Percentages of deltaApos versus deltaAneg DCs returning to quiescence versus undergoing reiterative divisions after a post-quiescence division (n = 5 reiterative division events for deltaAneg DCs, n = 22 events for deltaApos DCs, error bars for SEM). |
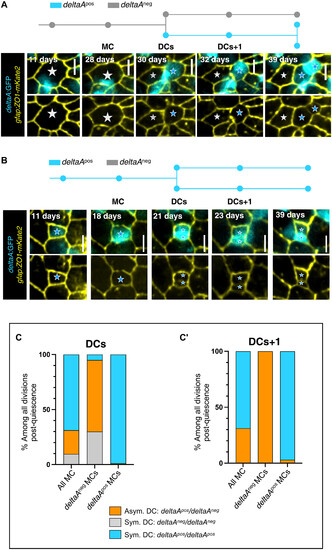
The deltaA expression status of NSCs predicts different division modes. (A and B) Examples of asymmetric (A) and symmetric (B) divisions based on deltaA expression. In each case, the track (deltaApos NSCs: blue; deltaAneg NSCs: gray) corresponds to the representative snapshots displayed underneath, showing gfap:ZO1-mKate2 (yellow) and deltaA:GFP (cyan) (top) or gfap:ZO1-mKate2 only (bottom). Stars to MC and its DCs (gray stars: deltaA OFF, blue stars: deltaA ON). (C and C′) Percentages of each division mode observed for DCs (C) and DCs+1 (C′) (asymmetric deltaAneg/deltaApos: orange; symmetric deltaAneg/deltaAneg: gray; symmetric deltaApos/deltaApos: blue) depending on the deltaApos or deltaAneg status of the MC. |
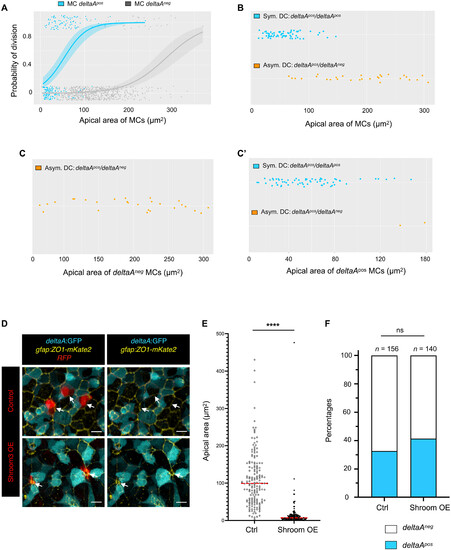
deltaA expression and AA individually predict NSC fate decisions. (A) Logistic regression model using AA and deltaA expression as covariates, showing the probability of NSC division as a function of AA for each deltaA expression status (deltaAneg MC: gray, deltaApos MC: blue). The statistical interaction between AA and deltaA was found statistically significant (type II Wald χ2 tests, P = 4.67 × 10⁻³). (B to C′) deltaA expression status in DC+1 pairs (symmetric deltaApos/deltaApos or asymmetric deltaAneg/deltaApos) as a function of the apical area of MCs, (B) when all MCs are considered together (deltaApos/deltaApos pair: blue, deltaAneg/deltaApos pair: orange), or (C) when deltaApos (blue) and (C′) when deltaAneg (gray) MCs are considered separately. (D) High magnification of the NSC layer showing shroom3-electroporated NSCs (Shroom3-mCherry, bottom row; control expressing mCherry only, top row) in 3-mpf Tg(deltaA:egfp) fish immunostained for GFP (cyan) and ZO1 (yellow). (E) Effect of Shroom3 overexpression on NSC AA. Shroom3-mCherry–overexpressing NSCs: n = 148, mean AA: 15 μm2; control electroporated NSCs: n = 167, mean AA: 109 μm2. Statistics: Nonparametric t test (Mann-Whitney test), P < 0.0001. (F) Effect of Shroom3 overexpression on deltaA expression. Proportion of deltaApos sNSCs among electroporated qNSCs: Shroom3-dsRed overexpression: 32% (n = 140); dsRed overexpression (control): 41% (n = 156). Statistics: Two-sided Fisher’s exact test, P value ns (not significant). |

deltaA expression and AA in mother NSCs predict NSC decisions independently of Notch signaling. (A) LY was added to the fish water for 7 days. Fish were imaged at days 1, 3, 5, 6, and 7 of treatment. (B) Merged and split snapshots, maximum projections (dorsal views) of a live-imaged 3-mpf casper;Tg(deltaA:eGFP);Tg(gfap:hZO1-mKate2) fish showing progressive NSC reactivation upon LY treatment (gfap:ZO1-mKate2: yellow, deltaA:GFP: cyan). Scale bars, 20 μm2. (C) Number of cells per segmented region (n = 3 fish, mean and error bars for SEM), normalized to the value at day −2, as a function of time [see (A)]. (D) Electroporation of deltaA-MO in Tg(gfap:dtTomato) shows no effect on the AA of GFAPpos cells (control MO: n = 123 cells, deltaA-MO: n = 55 cells). Statistics: Nonparametric t test (Mann-Whitney), P value ns, median in red. (E) Time window of reliable NSCs tracking upon LY treatment. (F) Logistic regression: Probability of NSC division as a function of AA for each MC deltaA status; compared untreated (CTRL) and LY conditions. Notch inhibition abolishes the differences in activation rate between deltaApos and deltaAneg NSCs (P = 0.16, χ2 test), but the AA effect persists. Predictions for CTRL: Rescaling of the rates over 4 days from all divisions over the duration of the movies; predictions for LY: estimated using all divisions over 4 days (see fig. S6A). Individual regressions pooled for this analysis: see (E). (G) Merged and split time-lapse images of a live-imaged 3-mpf casper;Tg(deltaA:eGFP);Tg(gfap:hZO1-mKate2) fish highlighting dividing NSCs (colored stars to MCs and their progeny) and nondividing NSCs (white dots) during the first and third days of LY treatment. Scale bars, 10 μm2. (H) Division modes based on deltaA expression in DCs, for divisions occurring after 3 days of LY (n = 3 fish) or in CTRL (n = 4 fish). |

Dynamic hierarchy of self-renewal and lineage progression based on AA and deltaA expression in adult pallial NSCs in situ. Schematic apical representations of NSCs and NPs, with relative AAs and deltaA expression (color coded), in an interpretative drawing resulting from the assembly of overlapping tracks, covering a time frame of weeks to months. The division of deltaAneg NSCs signs the transition from self-renewal to neurogenesis commitment. γneg and γpos are average activation rates for deltaAneg and deltaApos NSCs, respectively. |