
|
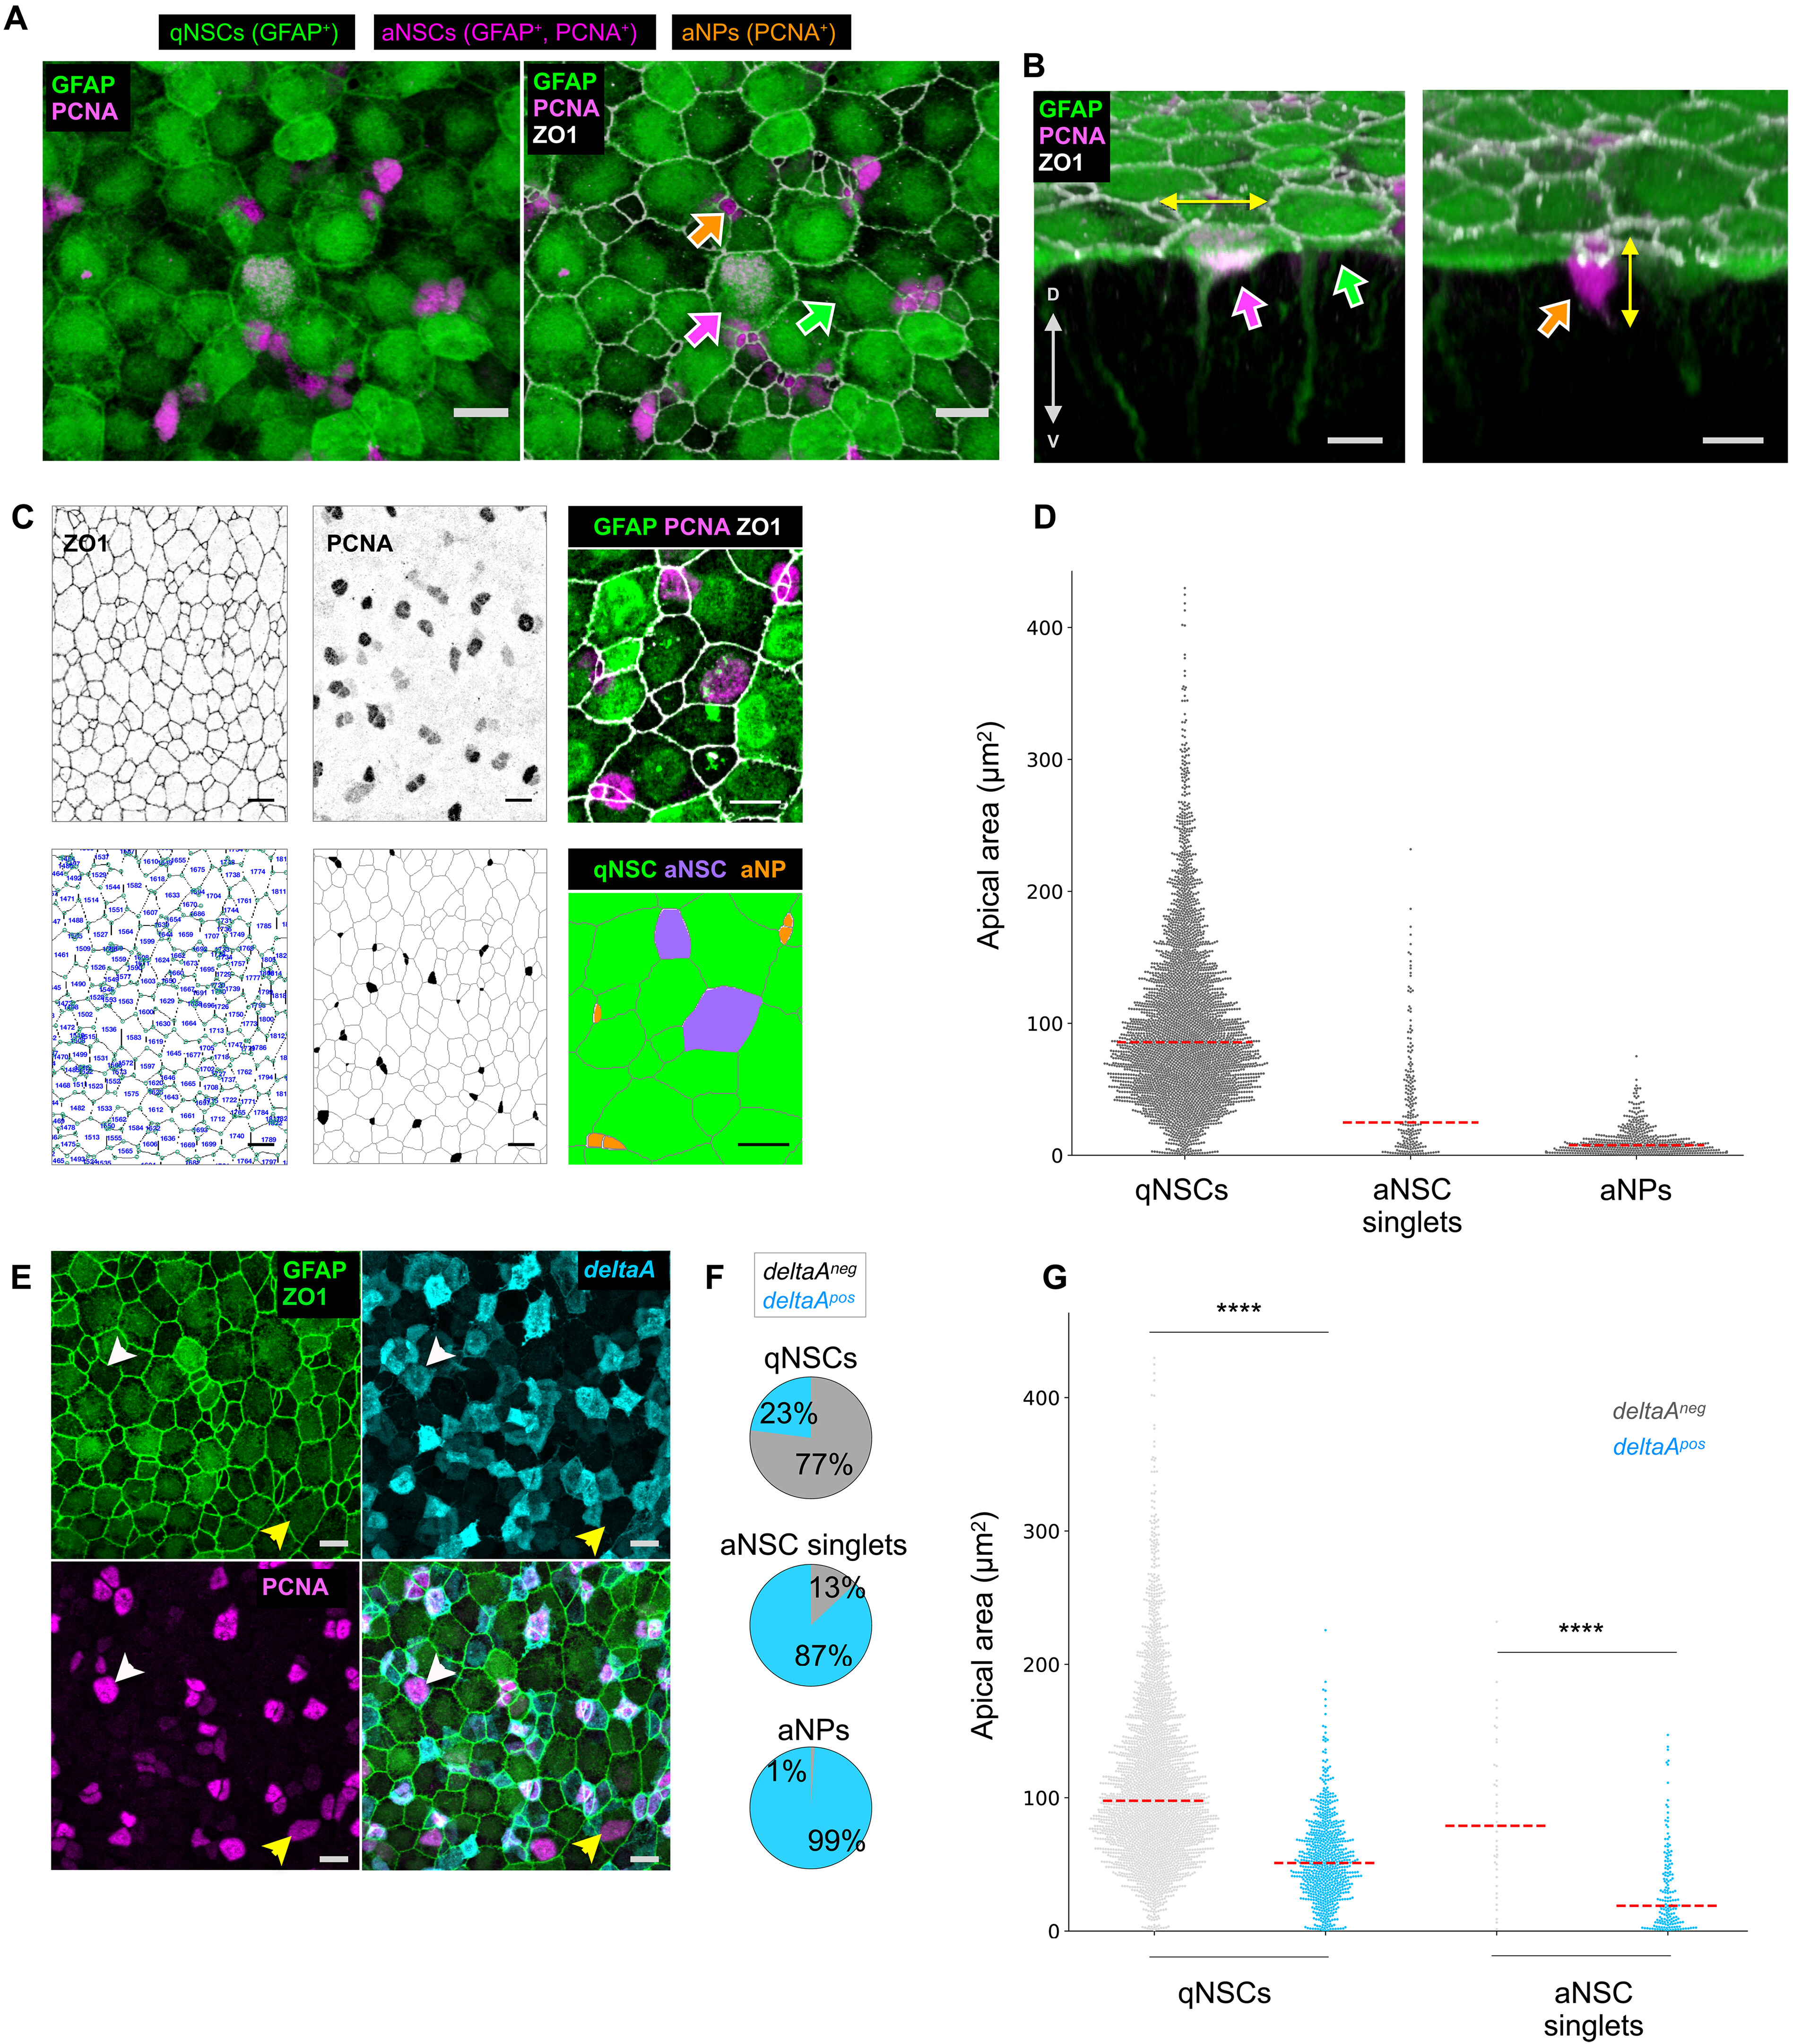
Fig. 1 Apical area correlates with cellular types and states in the germinal zone of the adult zebrafish pallium. (A and B) High magnification of a 3-mpf Tg(gfap:eGFP) whole-mount pallium processed for IHC for GFP (green), PCNA (magenta), and ZO1 (white). Arrowheads to qNSCs (GFP+, green), aNSCs (GFP+ PCNA+, magenta), and aNPs (PCNA+, orange). (A) Dorsal view. ZO1 reveals the apical area (AA) of each cell and the cellular topology of the tissue. (B) Optical section perpendicular to the pallial ventricular zone, passing, from left to right, through a qNSC, an aNSCs, and a cluster of two aNPs. Double-headed white arrow to the direction of the dorsoventral axis, double headed yellow arrows to the main axis of elongation of the nucleus in an aNSC and an aNP. Scale bars, 10 μm. (C) Top: Photographs of whole-mount pallia (dorsal views, Dm); bottom: corresponding segmented views (green circle: cell vertex). Left: Segmentation of AA based on ZO1 (blue number: cell ID used for subsequent analysis). Middle: Segmented regions with detected marker, here PCNA (manually corrected segmentation to avoid false-positive cells). Right: High magnification of a preparation stained for the markers of interest with the corresponding final segmentation and cell identities (color coded). (D) Distribution of AAs of qNSCs, aNSCs, and aNPs in Dm for four brains pooled. Red dashed lines: median. (E) Maximum projection of a dorsal view of a whole-mount IHC in a 3-mpf Tg(deltaA:eGFP);Tg(gfap:dtTOMATO) fish labeled for dTomato (green), ZO1 (green), eGFP (cyan), and PCNA (magenta). Arrowheads to a deltaApos aNSC (white) and deltaAneg aNSC (yellow). Scale bars, 10 μm. (F) Proportion of deltaApos cells (cyan) within the indicated cell types (n = 4 independent hemispheres, Dm). (G) Distribution of AAs in qNSCs and aNSC singlets according to deltaA expression. Red dashed line: median (n = 4 independent hemispheres, Dm). Statistics: Nonparametric t test (Mann-Whitney test), P < 0.0001.