
Fig. 5
- ID
- ZDB-FIG-231220-76
- Publication
- Mancini et al., 2023 - Apical size and deltaA expression predict adult neural stem cell decisions along lineage progression
- Other Figures
- All Figure Page
- Back to All Figure Page
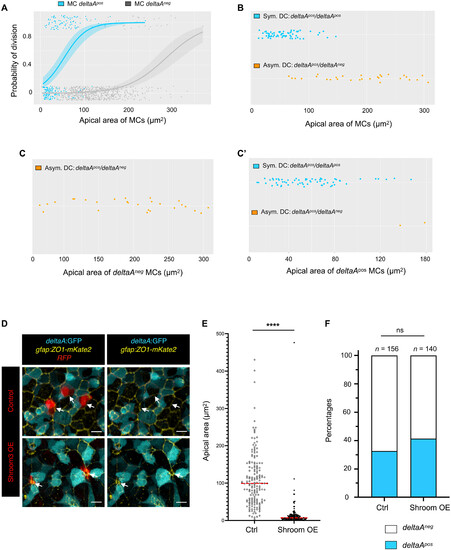
deltaA expression and AA individually predict NSC fate decisions. (A) Logistic regression model using AA and deltaA expression as covariates, showing the probability of NSC division as a function of AA for each deltaA expression status (deltaAneg MC: gray, deltaApos MC: blue). The statistical interaction between AA and deltaA was found statistically significant (type II Wald χ2 tests, P = 4.67 × 10⁻³). (B to C′) deltaA expression status in DC+1 pairs (symmetric deltaApos/deltaApos or asymmetric deltaAneg/deltaApos) as a function of the apical area of MCs, (B) when all MCs are considered together (deltaApos/deltaApos pair: blue, deltaAneg/deltaApos pair: orange), or (C) when deltaApos (blue) and (C′) when deltaAneg (gray) MCs are considered separately. (D) High magnification of the NSC layer showing shroom3-electroporated NSCs (Shroom3-mCherry, bottom row; control expressing mCherry only, top row) in 3-mpf Tg(deltaA:egfp) fish immunostained for GFP (cyan) and ZO1 (yellow). (E) Effect of Shroom3 overexpression on NSC AA. Shroom3-mCherry–overexpressing NSCs: n = 148, mean AA: 15 μm2; control electroporated NSCs: n = 167, mean AA: 109 μm2. Statistics: Nonparametric t test (Mann-Whitney test), P < 0.0001. (F) Effect of Shroom3 overexpression on deltaA expression. Proportion of deltaApos sNSCs among electroporated qNSCs: Shroom3-dsRed overexpression: 32% (n = 140); dsRed overexpression (control): 41% (n = 156). Statistics: Two-sided Fisher’s exact test, P value ns (not significant). |