
Image
|
Figure Caption
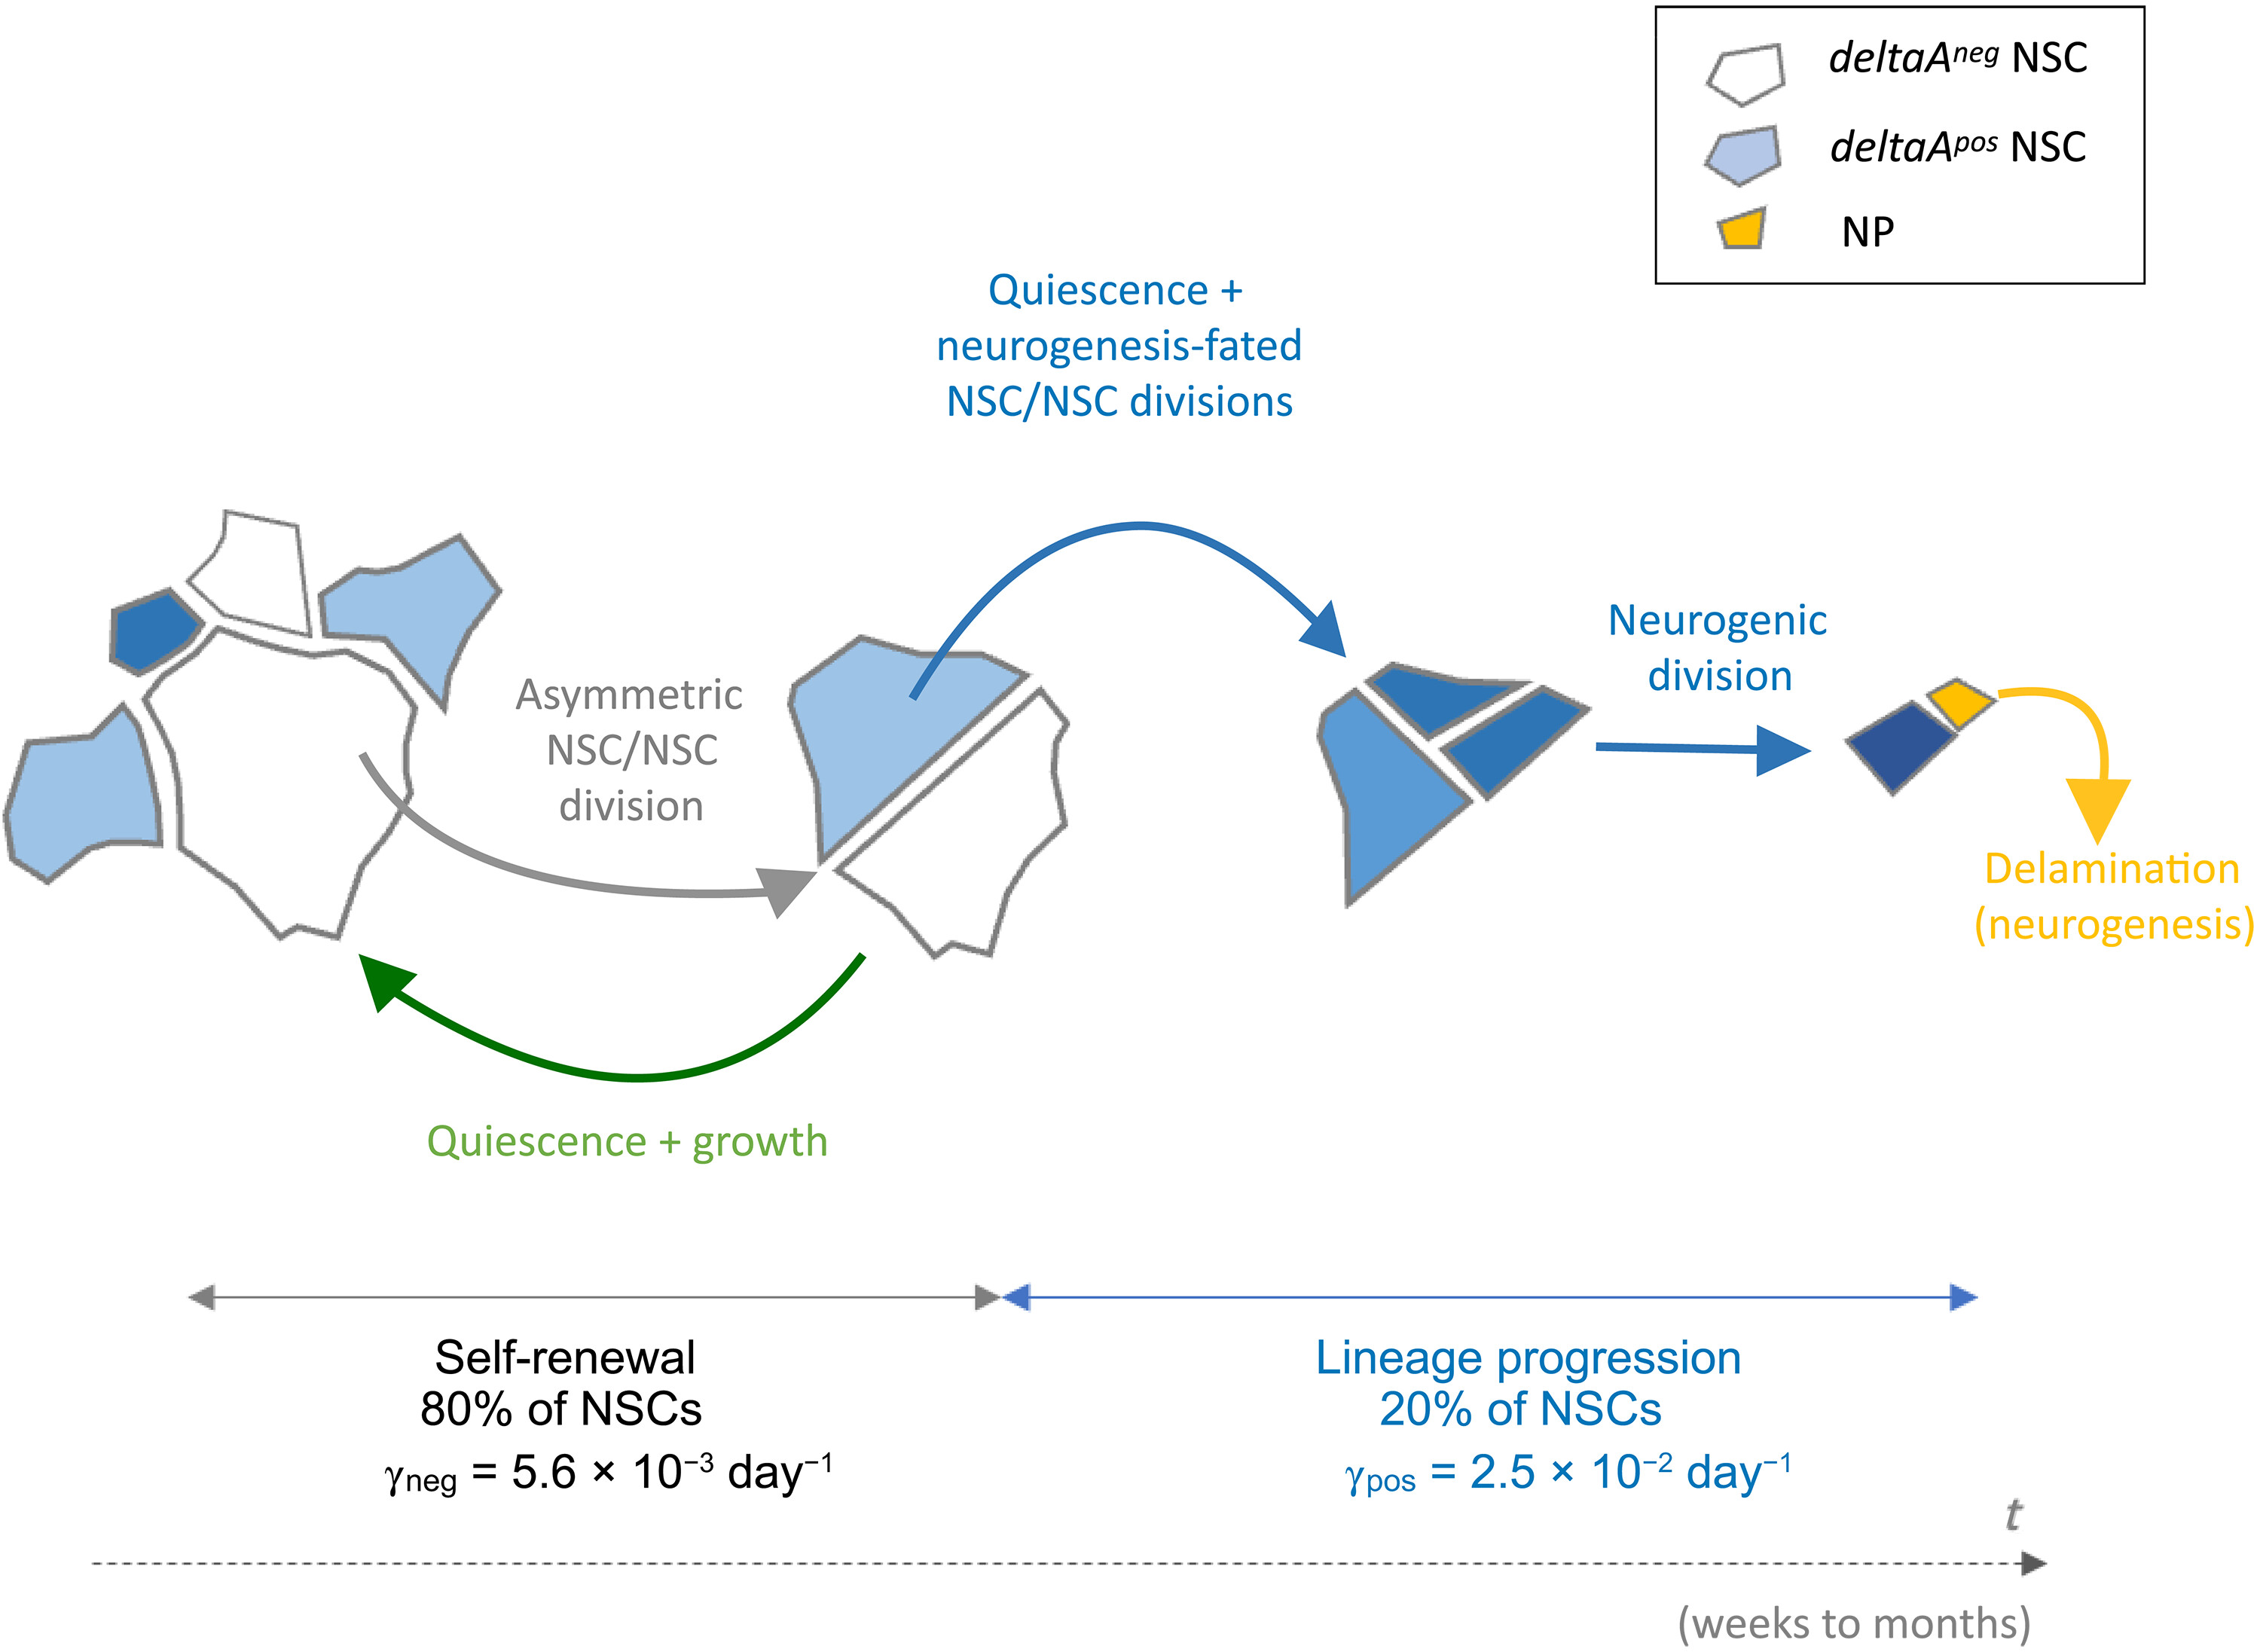
Fig. 7 Dynamic hierarchy of self-renewal and lineage progression based on AA and deltaA expression in adult pallial NSCs in situ. Schematic apical representations of NSCs and NPs, with relative AAs and deltaA expression (color coded), in an interpretative drawing resulting from the assembly of overlapping tracks, covering a time frame of weeks to months. The division of deltaAneg NSCs signs the transition from self-renewal to neurogenesis commitment. γneg and γpos are average activation rates for deltaAneg and deltaApos NSCs, respectively.
Acknowledgments
This image is the copyrighted work of the attributed author or publisher, and
ZFIN has permission only to display this image to its users.
Additional permissions should be obtained from the applicable author or publisher of the image.
Full text @ Sci Adv