FIGURE SUMMARY
Title

Treponema pallidum promoted microglia apoptosis and prevented itself from clearing by human microglia via blocking autophagic flux

Authors
Hu, Y.T., Wu, K.X., Wang, X.T., Zhao, Y.Y., Jiang, X.Y., Liu, D., Tong, M.L., Liu, L.L.
Source
Full text @ PLoS Pathog.

Treponema pallidum (Tp) infection decreases the numbers of microglia in Tg(mpeg1: EGFP) zebrafish embryos.

The number of microglia in Tp-treated Tg(mpeg1: EGFP) transgenic zebrafish embryos (Tp group) and untreated Tg(mpeg1: EGFP) transgenic zebrafish embryos (Control group) was counted at 2, 4, and 6 days postinfection (dpi). (A) Scheme of the experimental set up. Live one-cell stage Tg (mpeg1: EGFP) transgenic zebrafish embryos were exposed to either 0.1 μL PBS (Control group) or 0.1 μL of 109/mL Tp for 2, 4, and 6 days and then imaged with a confocal microscope. The region of interest is framed in red. (B) Tg (mpeg1: EGFP) transgenic zebrafish embryos injected with Tp revealed no developmental defect at 4dpi. Scale bar  =  1 mm. (C) Bright-field image and Confocal images of Tg (mpeg1: EGFP) transgenic zebrafish embryos at 2 dpi. Scale bar = 100 μm. (D) The number of microglia of Tg (mpeg1: EGFP) transgenic zebrafish embryos at 2 dpi. (E) Bright-field image and Confocal images of Tg (mpeg1: EGFP) transgenic zebrafish embryos at 4 dpi. Scale bar = 100 μm. (F) The number of microglia of Tg (mpeg1: EGFP) transgenic zebrafish embryos at 4 dpi. (G) Bright-field image and Confocal images of Tg (mpeg1: EGFP) transgenic zebrafish embryos at 6 dpi. Scale bar = 100 μm. (H) The number of microglia of Tg (mpeg1: EGFP) transgenic zebrafish embryos at 6 dpi. The data are shown as the mean ± SD, *P <0.05, n = 8.

Tp induces microglial apoptosis and activation in vitro.

The percentage of apoptotic cells was significantly increased in HMC3 cells treated with Tp compared to untreated HMC3 cells, and the percentage of normal cells was significantly decreased after Tp infection in a dose-dependent manner (MOI of 10:1, 50:1, 100:1 or 150:1). (A) HMC3 cells were treated with Tp (MOI of 10:1, 50:1, 100:1, or 150:1) for 24 h. The percentages of apoptotic cells and living cells were analysed by flow cytometry. (B) Apoptosis assay of HMC3 cells after Tp treatment at an MOI of 50:1 for 24 h by TUNEL staining. Scale bar  =  100 μm. (C) HMC3 cells were treated with Tp (MOI of 50:1) for 24 h and immunostained for IBA. Scale bar  =  100 μm. (D) HMC3 cells were treated with Tp (MOI of 50:1) for 24 h, and flow cytometry was used to analyse MHC-II expression. The data are shown as the mean ± SD. *P < 0.05, **P < 0.01, ***P < 0.001.

RNA sequencing revealed that Tp induces microglial activation and pathogenicity.

The gene transcription of HMC3 cells treated with Tp and untreated HMC3 cells was analysed by using RNA sequencing. (A) Heatmap showing hierarchical clustering of differentially expressed mRNAs. Red indicates relatively high expression, and blue represents relatively low expression. (B) Four genes were randomly selected to verify the results of transcriptome analysis by real-time qPCR. **P < 0.01, ***P < 0.001, n = 3. (C) GO enrichment analysis. (D) Correlation analysis of apoptotic gene and autophagy signalling pathway gene expression data from RNA-Seq.

Tp blocks the autophagic flux.

A tandem fluorescent-labelled plasmid pmCherry-EGFP-LC3B construct was transfected into HMC3 cells to quantify the numbers of different LC3 puncta and to assess the impact of Tp on the autophagic flux in HMC3 cells. In the absence of autophagy, the cells emitted diffuse yellow fluorescence. GFP (green fluorescence) is sensitive to the acidic environment of the lysosome and mCherry (red fluorescent) exhibits significant stability. After the initiation of autophagy, yellow puncta (RFP+ GFP+) indicated early autophagosomes, whereas red puncta (RFP+ GFP-) indicated late autophagosomes, showing that LC3 had been delivered to the lysosomes and that autophagosomes and lysosomes had fused to form autolysosomes. (A) The expression of LC3-I and LC3-II after HMC3 cells were treated with different concentrations of Tp for 24 h was measured by Western blotting. (B) Expression of the autophagy-related proteins Beclin1, LC3-I, LC3II and P62 after HMC3 cells were treated with Tp (MOI of 50:1) for different times was measured by Western blotting. (C) Expression of Lamp2 after HMC3 cells were treated with different concentrations of Tp for 24 h was measured by Western blotting. (D) HMC3 cells were transfected with the pmCherry-EGFP-LC3B plasmid, cocultured with or without Tp (MOI of 50:1) for 24 h, and analysed by confocal fluorescence microscopy. HMC3 cells were treated with BAF (bafilomycin, 80 nM) for 24 h as a positive control. Scale bar: 20 μm. The data are presented as the mean ± SD of three independent experiments. *P < 0.05, **P < 0.01, ***P < 0.001.

Tp blocks the autophagic flux in HMC3 cells by inhibiting TFEB nuclear translocation and reducing lysosomal biosynthesis via activation of the mTORC1 signalling pathway.

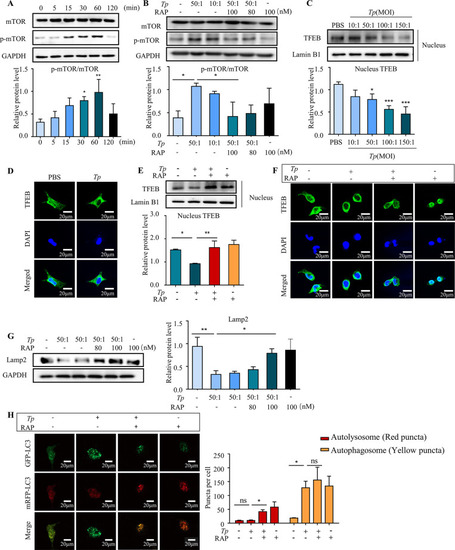
To assess mTOR activation in Tp-treated HMC3 cells, HMC3 cells were cultured with Tp (MOI of 50:1) for different times, and Western blotting was utilized to analyse mTOR signalling pathway components. To investigate the effect of mTORC1 signalling on lysosome biosynthesis and TFEB transcription activity, Western blotting and immunostaining were utilized to measure the expression of lysosome-associated membrane glycoprotein 2 (Lamp2) and nuclear levels of TFEB. To investigate the effect of mTORC1 signalling on the autophagic flux, a tandem fluorescent-labelled plasmid pmCherry-EGFP-LC3B construct was transfected into HMC3 cells. Then, HMC3 cells were pretreated with RAP (rapamycin, mTORC1 inhibitor, 100 nM) for 2 h and cocultured with Tp (MOI of 50:1) for 24 h. Finally, the results were observed under a confocal microscope. (A) Total mTOR protein levels and phosphorylated mTOR protein levels after HMC3 cells were treated with Tp (MOI of 50:1) for different times were measured by Western blotting. (B) HMC3 cells were pretreated with the mTORC1 signalling inhibitor RAP (rapamycin, 100 nM) for 2 h and then cocultured with Tp (MOI of 50:1) for 1 h. The effects of RAP on mTOR signalling were measured by Western blotting. (C) The nuclear levels of TFEB after HMC3 cells were treated with different concentrations of Tp for 24 h was measured by Western blotting. (D) HMC3 cells were treated with Tp (MOI of 50:1) for 24 h and immunostained for TFEB. Scale bar  =  100 μm. (E) HMC3 cells were pretreated with the mTORC1 signalling inhibitor RAP (rapamycin, 100 nM) for 2 h and then cocultured with Tp (MOI of 50:1) for 24 h. The effects of RAP on the nuclear levels of TFEB were measured by Western blotting. (F) HMC3 cells were pretreated with the mTORC1 signalling inhibitor RAP (rapamycin, 100 nM) for 2 h, cocultured with Tp (MOI of 50:1) for 24 h, and immunostained for TFEB. Scale bar  =  20 μm. (G) HMC3 cells were pretreated with the mTORC1 signalling inhibitor RAP (rapamycin, 100 nM) for 2 h and then cocultured with Tp (MOI of 50:1) for 24 h. The effects of RAP on Lamp2 expression were measured by Western blotting. (H) HMC3 cells were transfected with the pmCherry-EGFP-LC3B plasmid, pretreated with the mTORC1 signalling inhibitor RAP (rapamycin, 100 nM) for 2 h and cocultured with Tp (MOI of 50:1) for 24 h. The effects of RAP on the changes in the autophagic flux in HMC3 cells were analysed by confocal fluorescence microscopy. Scale bar: 20 μm. The data are presented as the mean ± SD of three independent experiments. *P < 0.05, **P < 0.01, ***P < 0.001.

The accumulation of autophagosomes is associated with the mechanism by which Tp induces apoptosis and inhibits its own clearance in HMC3 cells.

(A) HMC3 cells were treated with Tp (MOI of 50:1) with or without 3-MA (3-methyladenine, autophagosome formation inhibitor, 2 mM) for 24 h. The percentages of apoptotic cells and live cells were analysed by flow cytometry. (B) HMC3 cells were treated with Tp (MOI of 50:1) with or without 3-MA (3-methyladenine, autophagosome formation inhibitor, 2 mM) for 24 h. Apoptosis was analysed by TUNEL staining. Scale bar  =  100 μm. (C) HMC3 cells were treated with Tp (MOI of 10:1) with or without 3-MA (2 mM) for different times. The polA mRNA/DNA ratio was determined. The data are presented as the mean ± SD of three independent experiments. *P < 0.05, **P < 0.01, ***P < 0.001.

Tp promoted microglia apoptosis and prevented itself from clearing by human microglia via blocking autophagic flux.

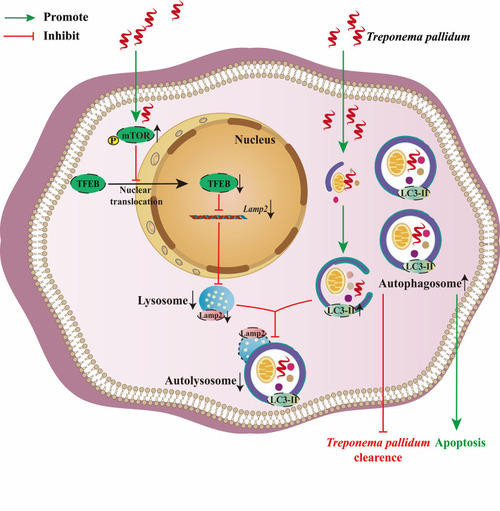
In this study, we demonstrated that Tp activated mTORC1 signalling to inhibit the nuclear translocation of transcription factor EB (TFEB), decreasing lysosomal biogenesis and causing autophagy arrest and autophagosome accumulation. Autophagosome accumulation was demonstrated to be a key mechanism by which Tp promoted microglia apoptosis and prevented itself from clearing by human microglia via blocking autophagic flux.

Acknowledgments
This image is the copyrighted work of the attributed author or publisher, and ZFIN has permission only to display this image to its users. Additional permissions should be obtained from the applicable author or publisher of the image. Full text @ PLoS Pathog.