FIGURE SUMMARY
Title

3D cell segregation geometry and dynamics are governed by tissue surface tension regulation

Authors
Méhes, E., Mones, E., Varga, M., Zsigmond, Á., Biri-Kovács, B., Nyitray, L., Barone, V., Krens, G., Heisenberg, C.P., Vicsek, T.
Source
Full text @ Commun Biol

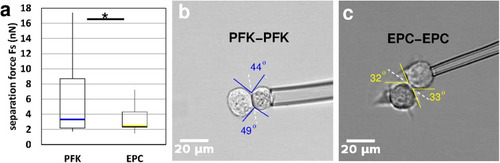
Characterization of homotypic contact strength by dual pipette aspiration assay.

a Separation forces Fs of primary goldfish keratinocyte (PFK) doublets (n = 13) and EPC keratinocyte doublets (n = 17) measured after 1 min contact formation, median values are highlighted by blue and yellow lines, asterisk (*) indicates statistically significant difference with Student’s t-test, p < 0.05. b, c Representative images of PFK doublets (b) or EPC doublets (c) held with a pipette during contact formation. Note the difference in contact angles highlighted by blue or yellow lines as a guide to the eye. Scale bar: 20 µm.

3D segregation of model cell types.

Representative epifluorescent images from image series of segregation experiments. a Segregation of primary goldfish keratinocytes (PFK, red) and EPC fish keratinocytes (EPC, green). b 3D segregation of human A431 epithelial carcinoma (A431, red) and human HT1080 fibrosarcoma (HT1080, green) cells. c Segregation of zebrafish ectoderm (red) and mesoderm (green) cells. Left panels in (ac) show the initial phase of segregation, and the right panels show the final spatial configuration of segregated homotypic domains. Time after the initial mixing of heterotypic cell suspensions is indicated at lower right corners, scale bars: 100 µm. Also, see Supplementary Movies 35.

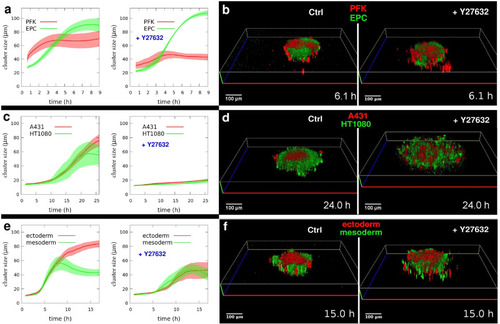
3D segregation dynamics depends on actomyosin contractility.

Quantitative analysis of segregating homotypic cell domain sizes. a Time-dependent growth of segregated cell domains in mixed suspensions of PKF and EPC keratinocytes untreated (left panel, n = 7) or treated with 100 µM Y27632 ROCK inhibitor (right panel, n = 4). b Representative 3D reconstruction images from time-lapse videos of segregating clusters of PFK (red) and EPC (green) keratinocytes after 6 h segregation in the absence (left panel) or presence (right panel) of ROCK inhibitor, see Supplementary Movie 6. c Analysis of segregated cell cluster sizes in A431 keratinocyte and HT1080 fibrosarcoma mixtures without (left, n = 6) or with 50 µM Y27632 inhibitor (right, n = 6). d Representative images of A431 (red) and HT1080 (green) segregation in the absence (left) or presence (right) of inhibitor after 24 h segregation, see Supplementary Movie 7. e Analysis of segregated clusters in zebrafish ectoderm and mesoderm mixtures without (left, n = 8) or with 100 µM Y27632 (right, n = 6). f Representative images of ectoderm (red) and mesoderm (green) segregation in the absence (left) or presence (right) of inhibitor after 15 h segregation, see Supplementary Movie 8. Error stripes represent SEM in (a, c, e). Time after the initial mixing of heterotypic cell suspensions is indicated at lower right corners in (b, d, f), scale bars: 100 µm. Also see Supplementary Fig. 1.

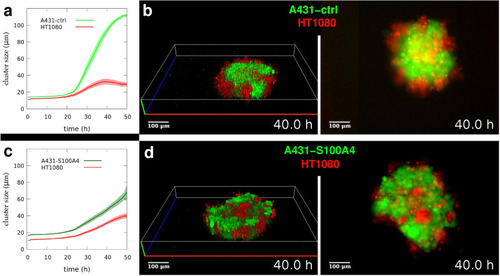
Aggregation dynamics depend on non-muscle myosin 2 assembly.

Quantitative analysis of aggregation of A431 cells. a Time-dependent decrease in the mean perimeter of spheroids aggregating from homotypic cell suspension of A431 cells overexpressing either NM2 assembly inhibitor S100A4 (A431-S100A4, n = 10) or its inactive mutant isoform (A431-ctrl, n = 10). Error stripes represent SEM, asterisk (*) at t = 24 h indicates a statistically significant difference with Student’s t-test, p < 0.01. b Representative phase-contrast images from time-lapse videos of spheroids of A431-ctrl cells (left panel) or A431-S100A4 cells (right panel) after 24 h aggregation from suspension. Note the difference in spheroid surface roughness. Scale bar: 100 µm. Also see Supplementary Movie 9 and Supplementary Fig. 3. c, d Schematic representations of surface cells highlighting the cytoskeletal components involved in cortical tension generation. c Normal cells with effective multicellular compaction characterized by large contact angle Θ due to the contracted actomyosin network at the cell-medium surface and relaxed actomyosin at the cell-cell interface coupled by cadherins. Assembly of NM2 monomers into filaments is controlled by normal levels of S100A4, assembly, and disassembly processes are symbolized by the double-headed arrow. d Experimentally increased levels of S100A4 lead to the sequestration of NM2 monomers and shifting towards the disassembly of filaments, assumed to result in a shift towards reduced cortical actomyosin tension and reduced multicellular compaction. Definitions of symbols are shown in the central text box.

Spatial positioning during segregation depends on non-muscle myosin 2 assembly and function.

a Time-dependent growth of segregated cell domains in mixed suspensions of A431 keratinocytes overexpressing inactive mutant S100A4 (A431-ctrl) and HT1080 fibrosarcoma cells (n = 6). b Representative 3D reconstruction (left panel) and simultaneous epifluorescent (right panel, bottom view) images from time-lapse videos of segregating clusters of A431-ctrl (green) and HT1080 (red) cells after 40 h of segregation, see Supplementary Movie 10. c Time-dependent growth of segregated domains in mixtures of A431 keratinocytes overexpressing NM2 assembly inhibitor S100A4 (A431-S100A4) and HT1080 fibrosarcoma cells (n = 6). d Representative 3D reconstruction (left panel) and epifluorescent (right panel, bottom view) images of segregating clusters of A431-S100A4 (green) and HT1080 (red) cells after 40 h of segregation, see Supplementary Movie 11. Note the inverted configuration of segregated domains here, compared to (b). Scale bar: 100 µm in (b, d). Error stripes represent SEM in (a, c). See also Supplementary Fig. 4.

Schematic summary of experimentally studied aspects of tissue surface tension regulation.

a Signaling from cell adhesion molecules to the cytoskeleton. Trans-binding of cell surface cadherins of contacting cells results in decreased actomyosin contractility and cortical tension at the cell-cell interface (Tcc). Green arrows indicate activation, and the red symbol represents inhibition. A detailed description of this signaling cascade and references are included in the Discussion. b Summary of tissue surface tension (TST) generation by cells in an aggregate, shown as a usual schematic representation. Cell cortical tension at the cell-medium interface (Tcm) and adhesion tension (Acc) contribute positively to TST whereas cortical tension at the cell-cell interface (Tcc) has a negative contribution. Tensions are represented by arrows. A contact angle Θ is indicated by dotted lines as a guide to the eye. c, d Schematic images of cell aggregates with key components of cortical tension regulation highlighted by symbols to explain the experimental interventions. c Normal cells at the surface of the aggregate showing effective multicellular compaction characterized by large contact angle Θ due to a relaxed actomyosin network at the cell-cell interface and low cortical tension as a result of signaling from trans-bound cadherins. d Genetically manipulated cells expressing the constitutively active ROCK isoform, which is expected to constantly activate actomyosin contractility at the cell-cell interface regardless of inactive endogenous ROCK here. The proposed impact is that caROCK maintains higher cortical tension at the cell-cell interface, leading to reduced TST and less effective compaction characterized by a smaller contact angle. Definitions of symbols are shown in the central text box.

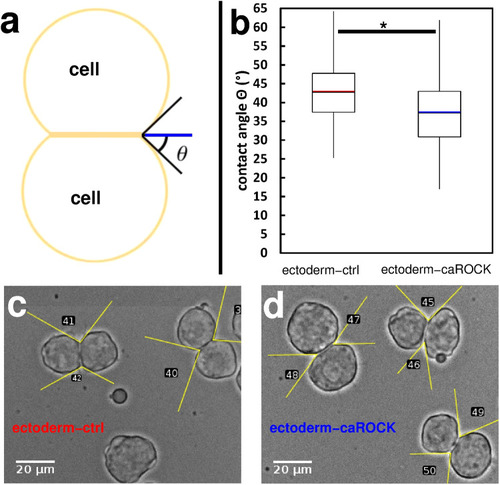
Contact formation is influenced by the regulation of actomyosin contractility.

a Schematic image of a homotypic cell doublet after contact formation. Contact angle Θ is indicated by lines as a guide to the eye. b Quantitative analysis of contact angles of homotypic doublets of untreated ectoderm cells (ectoderm-ctrl, n = 170) or ectoderm cells overexpressing constitutively active ROCK (ectoderm-caROCK, n = 210). Contact angles were measured after 30 min of contact formation. Median values are highlighted by red and blue lines, asterisk (*) indicates a statistically significant difference with Student’s t-test, p < 0.001. c, d Representative phase-contrast images of freely adhering homotypic cell doublets in ectoderm-ctrl (c) or ectoderm-caROCK (d) suspensions after 30 min. Note the difference between (c) and (d) in contact angles highlighted by yellow lines as a guide to the eye. Numbers are contact angle IDs for analysis. Scale bar: 20 µm.

Aggregation dynamics is influenced by regulation of actomyosin contractility.

Quantitative analysis of aggregation of zebrafish ectoderm cells. a Time-dependent decrease in the mean perimeter of spheroids aggregating from homotypic cell suspensions of either untreated ectoderm cells (ectoderm-ctr, n = 20) or ectoderm cells overexpressing constitutively active ROCK (ectoderm-caROCK, n = 20). Spheroid perimeters are normalized with and plotted as a percentage of initial perimeters, error stripes represent SEM, asterisk (*) at t = 10 h indicates a statistically significant difference with Student’s t-test, p < 0.01. b Representative phase-contrast images from time-lapse videos of spheroids of ectoderm-ctrl cells (left panel) or ectoderm-caROCK cells (right panel) after 10 h of aggregation. Note the difference in spheroid surface roughness. Scale bar: 100 µm. Also, see Supplementary Movie 12. cf Immunofluorescent detection of phospho-myosin light chain (p-MLC) in spheroids of ectoderm cells. c, d Ectoderm-ctrl spheroid with only p-MLC labeling (c) or merged image of p-MLC (yellow) and NucBlue (blue) labels. e, f A spheroid of ectoderm-caROCK cells labeled for p-MLC (e) or merged image of p-MLC label (yellow) and NucBlue (blue) staining. Cell nuclei are visualized by NucBlue staining. Note that the p-MLC immunofluorescence signal is hardly seen in (c) while it is much more pronounced after the introduction of caROCK in (e). Scale bar: 10 µm in cf.

Spatial configuration of segregated domains depends on actomyosin contractility regulation.

a Time-dependent increase in mean segregated cell cluster sizes in aggregates (n = 16) forming in mixed suspensions of normal zebrafish ectoderm cells (ectoderm-ctrl) and mesoderm cells. b Representative 3D reconstruction (left panel) and simultaneous epifluorescent (right panel, bottom view) images from time-lapse videos of segregating clusters of ectoderm-ctrl (red) and mesoderm (green) cells after 12 h of segregation, see Supplementary Movie 13. c Time-dependent growth of segregated cell cluster sizes in aggregates (n = 15) of mixed ectoderm cells overexpressing constitutively active ROCK (ectoderm-caROCK) and mesoderm cells. d Representative 3D reconstruction (left) and epifluorescent (right, bottom view) images of segregating clusters of ectoderm-caROCK (red) and mesoderm (green) cells after 12 h of segregation, see Supplementary Movie 14. Note the inverted spatial configuration of segregated domains here, compared to panel (b). Scale bar: 100 µm in (b, d). Error stripes represent SEM in (a, c). Also see Supplementary Fig. 5.

Acknowledgments
This image is the copyrighted work of the attributed author or publisher, and ZFIN has permission only to display this image to its users. Additional permissions should be obtained from the applicable author or publisher of the image. Full text @ Commun Biol