IMAGE

Fig. 7

ID
ZDB-IMAGE-230814-106
Source
Figures for Méhes et al., 2023
Image
Figure Caption

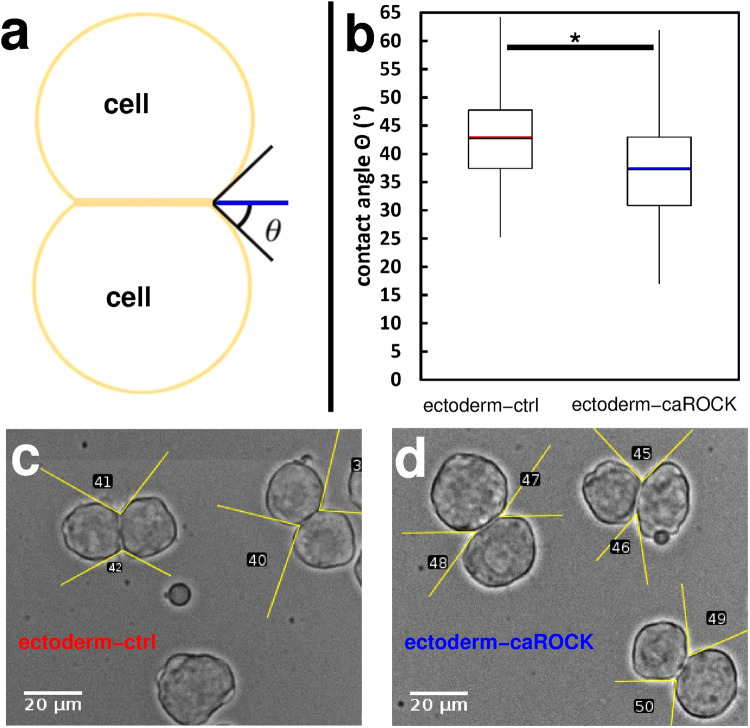
Fig. 7 Contact formation is influenced by the regulation of actomyosin contractility.

a Schematic image of a homotypic cell doublet after contact formation. Contact angle Θ is indicated by lines as a guide to the eye. b Quantitative analysis of contact angles of homotypic doublets of untreated ectoderm cells (ectoderm-ctrl, n = 170) or ectoderm cells overexpressing constitutively active ROCK (ectoderm-caROCK, n = 210). Contact angles were measured after 30 min of contact formation. Median values are highlighted by red and blue lines, asterisk (*) indicates a statistically significant difference with Student’s t-test, p < 0.001. c, d Representative phase-contrast images of freely adhering homotypic cell doublets in ectoderm-ctrl (c) or ectoderm-caROCK (d) suspensions after 30 min. Note the difference between (c) and (d) in contact angles highlighted by yellow lines as a guide to the eye. Numbers are contact angle IDs for analysis. Scale bar: 20 µm.

Acknowledgments
This image is the copyrighted work of the attributed author or publisher, and ZFIN has permission only to display this image to its users. Additional permissions should be obtained from the applicable author or publisher of the image. Full text @ Commun Biol