IMAGE

Fig. 8

ID
ZDB-IMAGE-230814-107
Source
Figures for Méhes et al., 2023
Image
Figure Caption

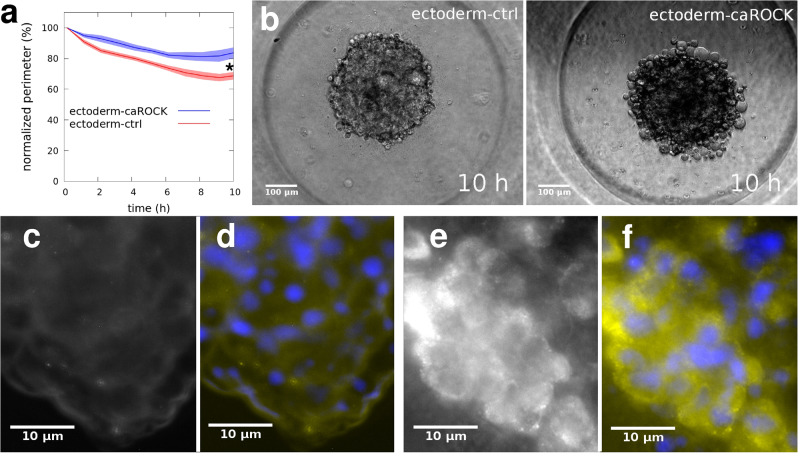
Fig. 8 Aggregation dynamics is influenced by regulation of actomyosin contractility.

Quantitative analysis of aggregation of zebrafish ectoderm cells. a Time-dependent decrease in the mean perimeter of spheroids aggregating from homotypic cell suspensions of either untreated ectoderm cells (ectoderm-ctr, n = 20) or ectoderm cells overexpressing constitutively active ROCK (ectoderm-caROCK, n = 20). Spheroid perimeters are normalized with and plotted as a percentage of initial perimeters, error stripes represent SEM, asterisk (*) at t = 10 h indicates a statistically significant difference with Student’s t-test, p < 0.01. b Representative phase-contrast images from time-lapse videos of spheroids of ectoderm-ctrl cells (left panel) or ectoderm-caROCK cells (right panel) after 10 h of aggregation. Note the difference in spheroid surface roughness. Scale bar: 100 µm. Also, see Supplementary Movie 12. cf Immunofluorescent detection of phospho-myosin light chain (p-MLC) in spheroids of ectoderm cells. c, d Ectoderm-ctrl spheroid with only p-MLC labeling (c) or merged image of p-MLC (yellow) and NucBlue (blue) labels. e, f A spheroid of ectoderm-caROCK cells labeled for p-MLC (e) or merged image of p-MLC label (yellow) and NucBlue (blue) staining. Cell nuclei are visualized by NucBlue staining. Note that the p-MLC immunofluorescence signal is hardly seen in (c) while it is much more pronounced after the introduction of caROCK in (e). Scale bar: 10 µm in cf.

Acknowledgments
This image is the copyrighted work of the attributed author or publisher, and ZFIN has permission only to display this image to its users. Additional permissions should be obtained from the applicable author or publisher of the image. Full text @ Commun Biol