FIGURE SUMMARY
Title

hoxa1a-Null Zebrafish as a Model for Studying HOXA1-Associated Heart Malformation in Bosley-Salih-Alorainy Syndrome

Authors
Wang, H., He, J., Han, X., Wu, X., Ye, X., Lv, W., Zu, Y.
Source
Full text @ Biology (Basel)

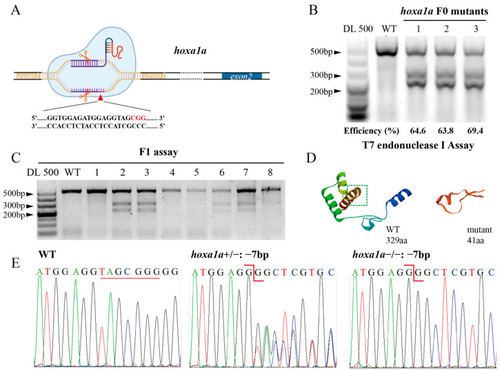
Construction of heritable hoxa1a mutants by CRISPR/Cas9. (A) Graphic illustration of CRISPR targeting the first exon in hoxa1a locus. (B) Determination of mutation efficiency by T7 Endonuclease I assay. Five founders with three replicates were examined. (C) Positive mutants in F1 offspring. (D) 3D structure prediction of normal 329aa hoxa1a protein and 41aa truncated mutant. (E) Sanger sequencing results of hoxa1a homozygous and heterozygous mutants.

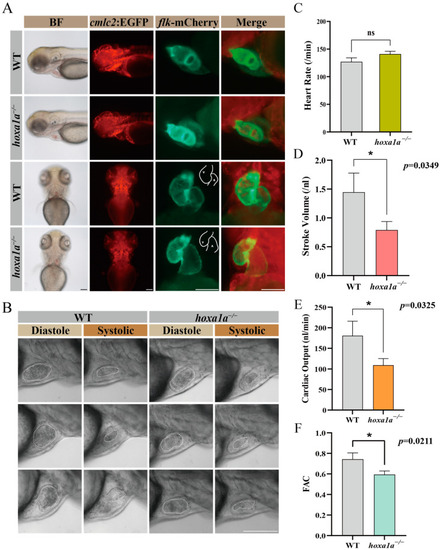
Embryo heart imaging by fluorescence and high-speed camera. (A) Top and lateral view of zebrafish under cmlc2-GFP, flk-mCherry and merge channel. Scale bar: 0.1 mm. (B) High-speed camera capturing blood flow (circled by white dashed line) and heart pumping in diastole and systole. Scale bar: 0.1 mm. (CF) Quantified analysis data after high-speed photography using ImageJ software. Heart rate (per minute), stroke volume (nL), cardiac output (CO, nL/min) and fractional area change (FAC). Student’s t-test, *: p < 0.05, ns: no statistical difference.

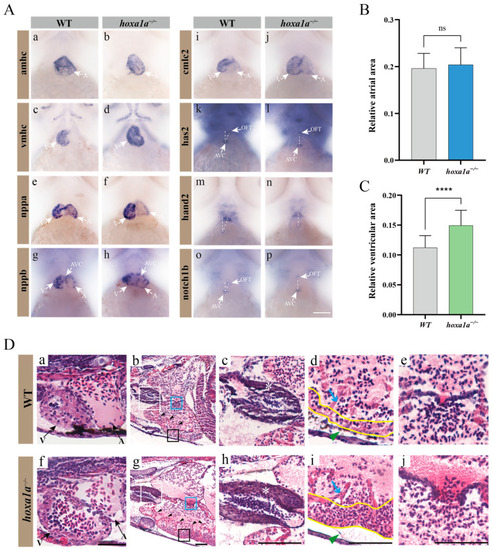
Multiple heart malformation in hoxa1a homozygous embryos. (A) In situ hybridization in 3 dpf embryos using heart labeling RNA probes—amhc (a,b), vmhc (c,d), nppa (e,f), nppb (g,h), cmlc2 (i,j), has2 (k,l), hand2 (m,n), notch1b (o,p). (B) Quantified data of atrial area in (A-b) amhc and Supplementary Figure S7 (n = 3), Student’s t-test, ns: no statistical difference. (C) Quantified data of ventricular area in (A-d) vmhc and Supplementary Figure S8 (n = 3), Student’s t-test, ****: p < 0.0001. (D) Longitudinal sectional images stained with H&E through pericardial cavity of in hoxa1a−/− adult mutants; see also Supplementary Figure S9. Scale bar: 0.2 mm. (a,f)-ventricle and atrium in 3 dpf embryos; (b,g)-heart morphology in 1-month-old zebrafish, areas of OFT (white squares), myocardium (black squares) and AVC (blue squares) are zoomed in, black arrows-trabeculae; (c,h)-OFT, zoomed-in images from white squares in b and g, white asterisk-OFT walls; (d,i)-myocardium, zoomed-in images from black squares in b and g, blue arrow-trabeculae, yellow wave-myocardium; (e,j)-AVC, zoomed-in images from blue squares in b and g.

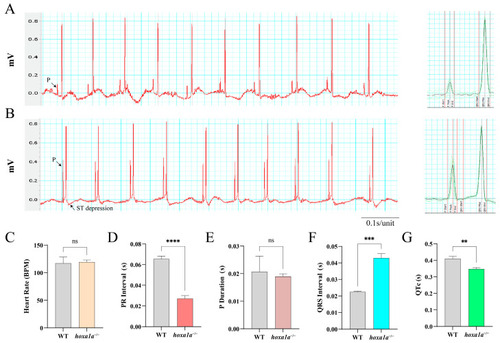
ECG analysis of adult zebrafish. Electrical signal obtained from chest muscle layer in WT (A) and hoxa1a−/− (B), Heart rate (BPM) (C), PR interval(s) (D), P duration (s) (E), QRS interval(s) (F), QTc(s) (G). Student’s t-test, ** p < 0.05, *** p < 0.001, **** p < 0.0001, ns: no statistical difference.

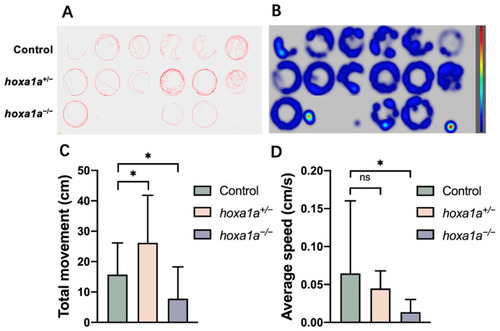
Behavior test for mobility analysis in in hoxa1a mutants. (A) Digital tracks of 6 dpf larvae from wild type, hoxa1a+/− and hoxa1a−/−. (B) Heat maps of digital track A. (C) Total movement measurement (cm), Student’s t-test, *: p < 0.05. (D) Average speed measurement (cm/s), Student’s t-test, *: p < 0.05, ns: no statistical difference.

hoxa1a paralogous regulation. (A) Results of qPCR for paralogous genes in the hox gene cluster in the embryonic zebrafish. (Student’s t-test, ** p < 0.05, *** p < 0.001, **** p < 0.0001). (B) Phylogenetic tree showing relationships between hoxa1a and paralogous hox genes in zebrafish.

Acknowledgments
This image is the copyrighted work of the attributed author or publisher, and ZFIN has permission only to display this image to its users. Additional permissions should be obtained from the applicable author or publisher of the image. Full text @ Biology (Basel)