FIGURE SUMMARY
Title

Zebrafish as a model for cardiac disease; Cryo-EM structure of native cardiac thin filaments from Danio Rerio

Authors
Bradshaw, M., Squire, J.M., Morris, E., Atkinson, G., Richardson, R., Lees, J., Caputo, M., Bigotti, G.M., Paul, D.M.
Source
Full text @ J. Muscle Res. Cell Motil.

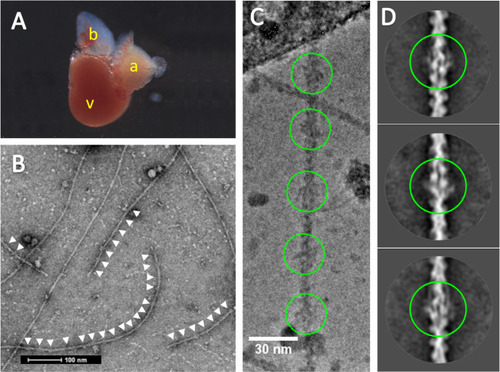
Cryo-EM of zebrafish cardiac thin filaments. A: An excised adult Zebrafish heart, letters (in yellow) show V-Ventricle, A-Atrium B-bulbus arteriosus. B: A typical negative stain EM micrograph of isolated thin filaments, visible troponin complexes indicated with white arrows. C: Cryo-EM image illustrating the periodic binding of troponin on the thin filament (green circles) at a spacing of ~ 385Å D: 2D class averages from cryo-EM data with pairs of troponin labelling the two strands of actin (green circles); tropomyosin strands are also visible (top and bottom images)

3D reconstruction of native zebrafish cardiac thin filaments and comparison to human reconstituted thin filament structure. A-D: Surface rendered protein density map, highlighting the thin filament constituent proteins, segmented and colour coded as follows; Tn1 green, Tn2 blue, tropomyosin pink and actin purple. A & B: views of the complete map oriented to illustrate the two distinct paths taken by individual troponin molecules on each side of the thin filament as they span the two tropomyosin strands. A & B are related by 180o rotation about the central axis of the thin filament. The different paths of troponin are apparent; Tn1 is located higher on the filament than Tn2, however, the TnT linker peptide path of Tn1 to tropomyosin is longer than that of Tn2. More density is recovered for Tn1 despite its linker peptide following the longer path. C & D: Close up views of the troponin core domain illustrating its rotated ‘L’ shape which is consistent on both sides. Views as in A & B but rotated by 60o about the central axis. Segmented regions calculated using ChimeraX. The pointed (-) and barbed end (+) of the actin filament are indicated. EJ: The zebrafish (yellow) and Yamada (purple) high Ca2+ state reconstructions are superposed. E & F: Extra protein density in Tn1 and Tn2 core regions is visible in the zebrafish map. G & J: Tropomyosin and actin densities are similar. H: Strong similarity in TnT T1 domains interacting with tropomyosin overlap region. I: Extra TnT linker-region density in the zebrafish map not present in other thin filament maps

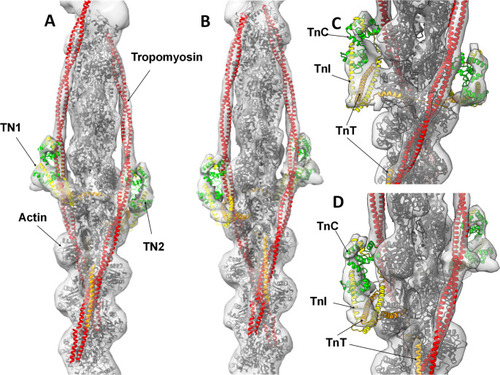
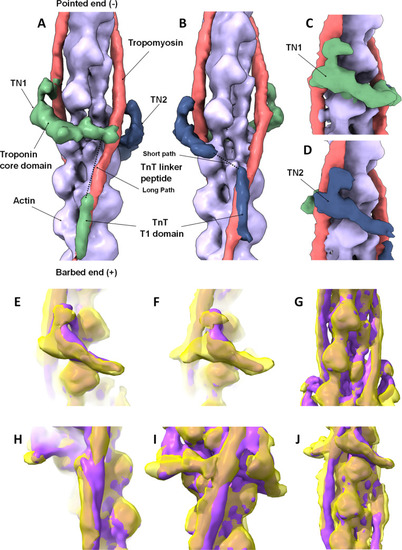
Zebrafish high Ca2+ thin filament model. The full-length actin (grey), TnC (residues 2-161, zebrafish 2-161) green, TnI (41–166, zebrafish 10–135) yellow, TnT (99–272, zebrafish 101–207) orange, full length tropomyosin red, atomic models docked into the electron density. A & B: 180° rotations, C & D: close up of the central region with 180° rotations

Conformation of troponin core domain and tropomyosin positions. The high and low Ca2+ models 6KN8 (green) and 6KN7 (blue) were docked into our thin filament reconstruction and compared to our zebrafish model (yellow). A & B: the core domains of Tn1 and Tn2. Regions of empty density are indicated with *. B: ɑ (45°) & (35°) the angle the TnI helix 1 makes with the horizontal in the two states C & D: the tropomyosin overlap region where TnT1 domain is located of Tn1 and Tn2 respectively. E,F, & G: Pairwise comparison of the position of tropomyosin from the three models

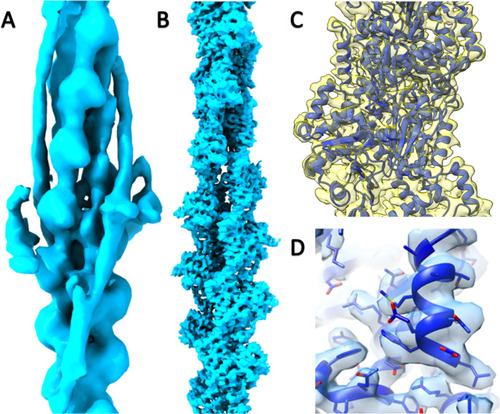
Cryo-EM reconstructions of the zebrafish thin filament and actin filament. A: The complete asymmetric unit of the thin filament composed of 14 actin subunits, 2 tropomyosin and troponin complexes. B: An equivalent region of the actin filament composed of 14 actin subunits. C: Detailed region of the actin filament map (yellow) with cartoon representation of the fitted coordinates (blue). D: Detailed region of an individual actin subunit protein density with side chains coordinates represented as sticks

Acknowledgments
This image is the copyrighted work of the attributed author or publisher, and ZFIN has permission only to display this image to its users. Additional permissions should be obtained from the applicable author or publisher of the image. Full text @ J. Muscle Res. Cell Motil.