
Image
|
Figure Caption
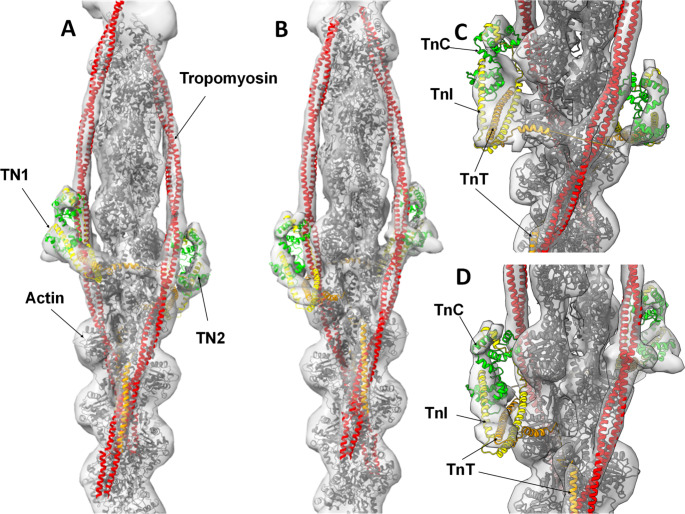
Fig. 3
Zebrafish high Ca2+ thin filament model. The full-length actin (grey), TnC (residues 2-161, zebrafish 2-161) green, TnI (41–166, zebrafish 10–135) yellow, TnT (99–272, zebrafish 101–207) orange, full length tropomyosin red, atomic models docked into the electron density.
Acknowledgments
This image is the copyrighted work of the attributed author or publisher, and
ZFIN has permission only to display this image to its users.
Additional permissions should be obtained from the applicable author or publisher of the image.
Full text @ J. Muscle Res. Cell Motil.