
- Title
-
Individual differences in response to alcohol and nicotine in zebrafish: gene expression and behavior
- Authors
- Araujo-Silva, H., de Souza, A.M., Mamede, J.P.M., Batistuzzo de Medeiros, S.R., Luchiari, A.C.
- Source
- Full text @ Dev. Growth Diff.
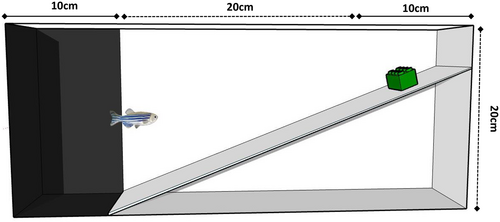
Overview of the exploration tank with ramp (40 cm x 10 cm x 20 cm; 23° of inclination), showing the flat area (black), the ramp area, and the object area. The whole bottom of the tank was completely covered with opaque self-adhesive plastic films (white or black). At the top of the ramp, there was a green cubic object (3 cm2) |
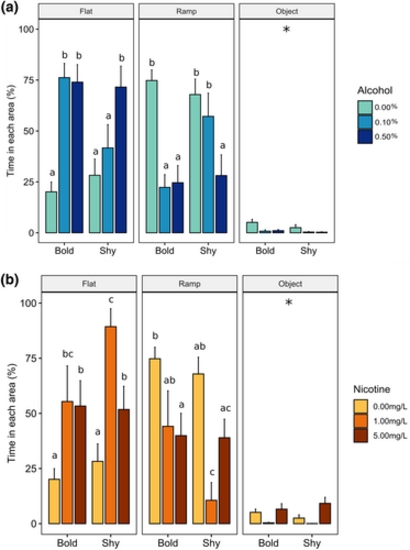
Zebrafish behavior in the exploration tank with ramp after (a) alcohol or (b) nicotine treatment. The experimental tank was divided into three areas: a flat area, a ramp area, and an object area located at the top of the ramp. Fish were acutely treated with alcohol (60 min, n = 10 per group) or nicotine (3 min, n = 10 per group) and then placed in the ramp tank (flat area). Behavior was recorded for 10 min. Results are presented as mean ± SEM. Different letters indicate statistically significant differences between treatments in each area (bold and shy groups: three-way ANOVA, p < .05). Asterisks indicate statistically significant differences between areas (p < .05) |
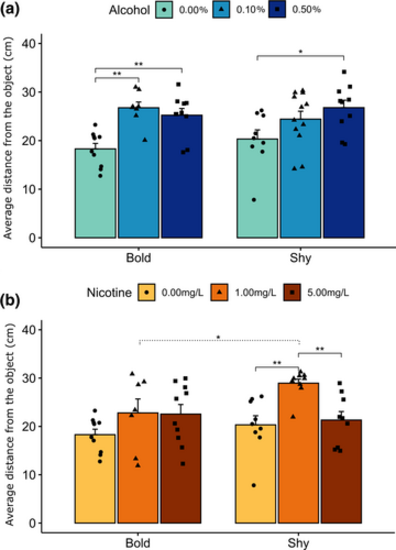
Average distance from the object (mean + SEM). Zebrafish were acutely exposed to (a) alcohol (60 min) or (b) nicotine (3 min) and then tested in the ramp tank (10 min). Solid lines indicate statistically significant differences between treatments in the same profile. Dotted lines indicate statistically significant differences among profiles (bold and shy groups). Asterisks indicate values of statistical significance (*p ≤ .05, **p ≤ .01). |
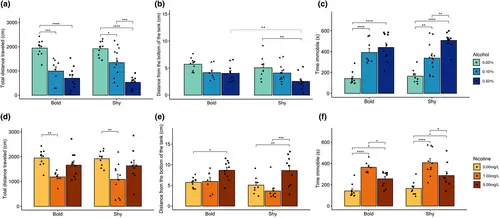
Locomotor and anxiety-like behavior of zebrafish with different profiles for 10 min in the test tank after alcohol or nicotine exposure. Results are presented as mean + SEM. (a–c) Total distance traveled (a), distance from the bottom of the tank (b), and time immobile (c) of animals treated with alcohol. (d–f) Total distance traveled (d), distance from the bottom of the tank (e), and time immobile (f) of animals treated with nicotine. Two-way ANOVA was performed. Solid lines indicate statistically significant differences between treatments for each profile. Dotted lines indicate statistically significant differences among behavioral profiles. Asterisks indicate values of statistical significance (*p ≤ .05, **p ≤ .01, ***p ≤ .001, ****p ≤ .0001) |
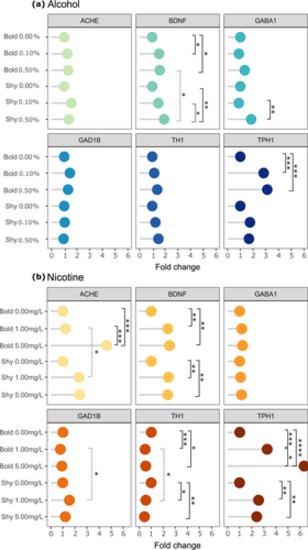
Dot plot visualization of RT-qPCR analysis of relative mRNA expression (fold change) of bold and shy zebrafish exposed to alcohol or nicotine. Target genes are known to be affected directly or indirectly by alcohol and nicotine. Acetylcholinesterase (ache), brain-derived neurotrophic factor (bdnf), GABAA receptor (gaba1), glutamate decarboxylase (gad1b), tyrosine hydroxylase (th1), and tryptophan hydroxylase (tph1) were analyzed. mRNA expression was compared between alcohol or nicotine treatments within the behavioral profiles (bold and shy). All RT-qPCR analyses were conducted in triplicate. Two-way ANOVA followed by the Bonferroni test was performed (p < .05). Solid lines indicate statistically significant differences between treatments in each profile. Dotted lines indicate statistically significant difference among behavioral profiles. Asterisks indicate values of statistical significance (*p ≤ .05, **p ≤ .01, ***p ≤ .001, ****p ≤ .0001). |