
FIGURE
Fig. 3
- ID
- ZDB-FIG-240131-10
- Publication
- Araujo-Silva et al., 2023 - Individual differences in response to alcohol and nicotine in zebrafish: gene expression and behavior
- Other Figures
- All Figure Page
- Back to All Figure Page
Fig. 3
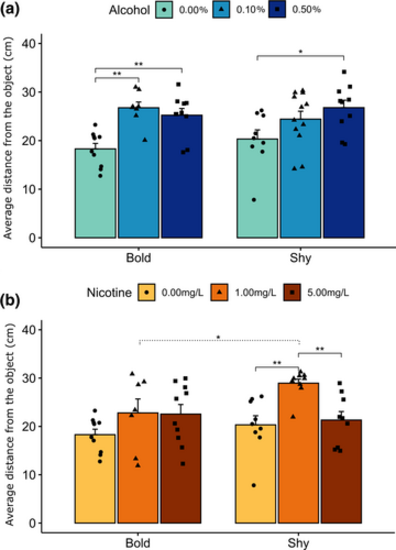
Average distance from the object (mean + SEM). Zebrafish were acutely exposed to (a) alcohol (60 min) or (b) nicotine (3 min) and then tested in the ramp tank (10 min). Solid lines indicate statistically significant differences between treatments in the same profile. Dotted lines indicate statistically significant differences among profiles (bold and shy groups). Asterisks indicate values of statistical significance (*p ≤ .05, **p ≤ .01). |
Expression Data
Expression Detail
Antibody Labeling
Phenotype Data
Phenotype Detail
Acknowledgments
This image is the copyrighted work of the attributed author or publisher, and
ZFIN has permission only to display this image to its users.
Additional permissions should be obtained from the applicable author or publisher of the image.
Full text @ Dev. Growth Diff.