
Fig. 5
- ID
- ZDB-FIG-240131-12
- Publication
- Araujo-Silva et al., 2023 - Individual differences in response to alcohol and nicotine in zebrafish: gene expression and behavior
- Other Figures
- All Figure Page
- Back to All Figure Page
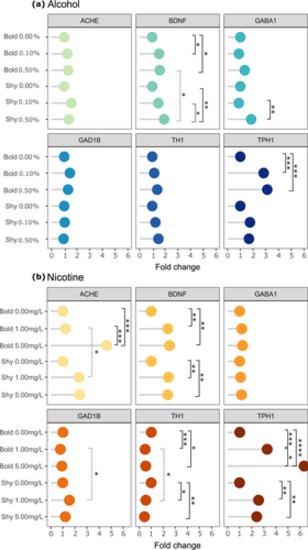
Dot plot visualization of RT-qPCR analysis of relative mRNA expression (fold change) of bold and shy zebrafish exposed to alcohol or nicotine. Target genes are known to be affected directly or indirectly by alcohol and nicotine. Acetylcholinesterase (ache), brain-derived neurotrophic factor (bdnf), GABAA receptor (gaba1), glutamate decarboxylase (gad1b), tyrosine hydroxylase (th1), and tryptophan hydroxylase (tph1) were analyzed. mRNA expression was compared between alcohol or nicotine treatments within the behavioral profiles (bold and shy). All RT-qPCR analyses were conducted in triplicate. Two-way ANOVA followed by the Bonferroni test was performed (p < .05). Solid lines indicate statistically significant differences between treatments in each profile. Dotted lines indicate statistically significant difference among behavioral profiles. Asterisks indicate values of statistical significance (*p ≤ .05, **p ≤ .01, ***p ≤ .001, ****p ≤ .0001). |