
|
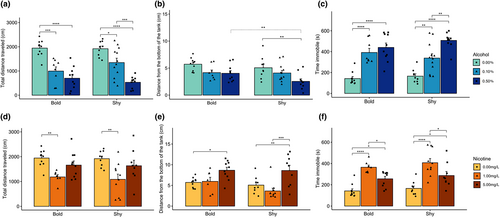
Fig. 4 Locomotor and anxiety-like behavior of zebrafish with different profiles for 10 min in the test tank after alcohol or nicotine exposure. Results are presented as mean + SEM. (a–c) Total distance traveled (a), distance from the bottom of the tank (b), and time immobile (c) of animals treated with alcohol. (d–f) Total distance traveled (d), distance from the bottom of the tank (e), and time immobile (f) of animals treated with nicotine. Two-way ANOVA was performed. Solid lines indicate statistically significant differences between treatments for each profile. Dotted lines indicate statistically significant differences among behavioral profiles. Asterisks indicate values of statistical significance (*p ≤ .05, **p ≤ .01, ***p ≤ .001, ****p ≤ .0001)