
- Title
-
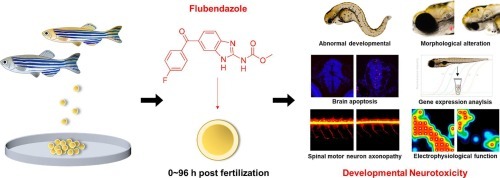
Flubendazole exposure disrupts neural development and function of zebrafish embryos (Danio rerio)
- Authors
- Kim, J., Bang, J., Ryu, B., Kim, C.Y., Park, J.H.
- Source
- Full text @ Sci. Total Environ.
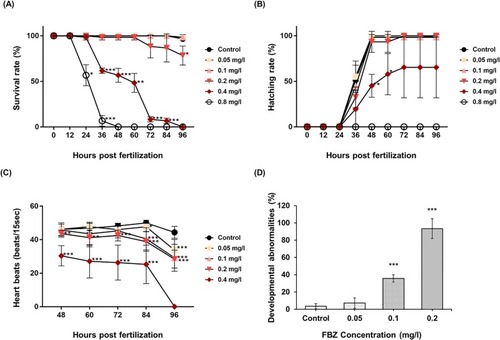
Toxic effects of Flubendazole (FBZ) in zebrafish embryo development. (A) Survival rates and (B) hatching rates of zebrafish embryos exposed to FBZ (control, 0.05, 0.1, 0.2, 0.4, and 0.8 mg/l) for 96 h post fertilization (hpf). n = 3 experiments, n = 20 embryos per experiments in each group. Data represent the mean ± SEM. (C) Heart beats per 15 s until 96 hpf (control, 0.05, 0.1, 0.2, and 0.4 mg/l). n = 10 embryos per group. Data represent the mean ± SD. (D) The percentage of abnormally developed zebrafish embryos at 96 hpf (control, 0.05, 0.1, and 0.2 mg/l); Pericardial edema, yolk sac edema, head and eye deformity, and axial malformation. n = 3 experiments, n = 20 embryos per experiments in each group. Data represent the mean ± SEM. *P < 0.05; **P < 0.01; ***P < 0.001. |

Morphological alterations related to developmental neurotoxicity induced by FBZ exposure. (A) The craniofacial structure of FBZ-treated zebrafish at 96 hpf. Scale bar = 350 μm. (B) Body length, head size and eye size of embryos. n = 10 embryos per group. Data represent the mean ± SD. *P < 0.05; **P < 0.01; ***P < 0.001. |

Apoptosis in zebrafish embryo induced by FBZ exposure until 96 hpf. (A) The acridine orange positive cells detected in the zebrafish brain region (white arrowhead). Scale bar = 400 μm. (B) Enlarged space between the skull and brain (asterisk) and pyknotic nuclei (red arrowhead) in histopathological analysis of zebrafish exposed to FBZ (0.1, and 0.2 mg/l). Scale bar = 100 μm. (C) TUNEL analysis of zebrafish brain exposed to control, 0.05, 0.1, and 0.2 mg/l of FBZ. Scale bar = 100 μm. |

Gene expression changes following FBZ exposure. The expression of (A) apoptosis-related genes (tumor protein p53 (p53), b-cell lymphoma 2 (bcl2), caspase 3 (casp3), caspase 8 (casp8), and caspase 9 (casp9)), (B) neurogenesis-related genes (sonic hedgehog a (Shha), neurogenin 1 (ngn1), neurod (nrd), and elav like neuron specific rna binding protein 3 (elavl3)), and (C) axon growth and neuronal maturation (glial fibrillary acidic protein (gfap), myelin basic protein (mbp), alpha 1 tubulin (α1-tubulin), growth associated protein 43 (gap43), and synapsin IIa (syn2a)). Data are quantified with standard curves using elongation factor 1-alpha (ef1α) and actin, beta 1 (β-actin) as a reference gene and normalized to control. Data represent the mean ± SD. *P < 0.05; **P < 0.01; ***P < 0.001. |
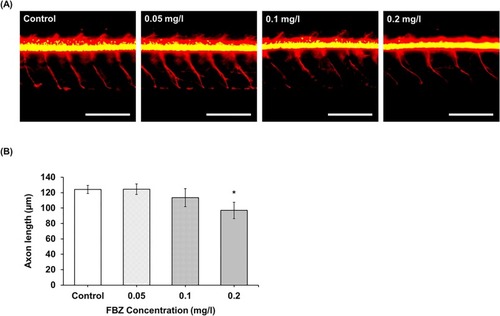
Axon structure of FBZ-treated transgenic zebrafish at 96 hpf. (A) RFP expressing spinal cord axon in Tg(olig2-dsRED) zebrafish are shown in control, 0.05, 0.1, and 0.2 mg/l FBZ. Scale bar = 150 μm. (B) Axon length of Tg(olig2-dsRED) zebrafish (μm). n = 3 embryos per group. Data represent the mean ± SD. *P < 0.05. |
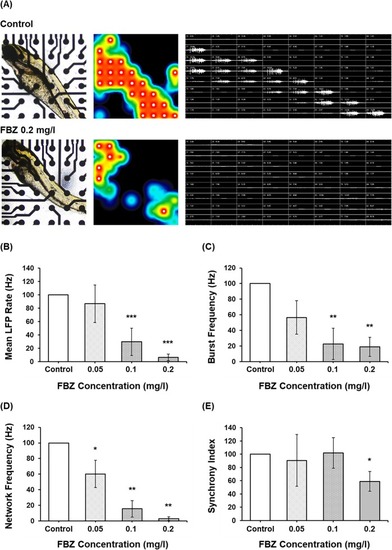
(A) Representative heat map and waveform images of zebrafish multi-electrode array recording (control and 0.2 mg/l of FBZ). (B) Mean local field potential Rate (Hz), (C) burst frequency (Hz), (D) network burst frequency (Hz), and (E) synchrony index. n = 4 embryos per group. Data represent the mean ± SD. *P < 0.05; **P < 0.01; ***P < 0.001. |
|