
FIGURE
Fig. 6
- ID
- ZDB-FIG-240105-20
- Publication
- Kim et al., 2023 - Flubendazole exposure disrupts neural development and function of zebrafish embryos (Danio rerio)
- Other Figures
- All Figure Page
- Back to All Figure Page
Fig. 6
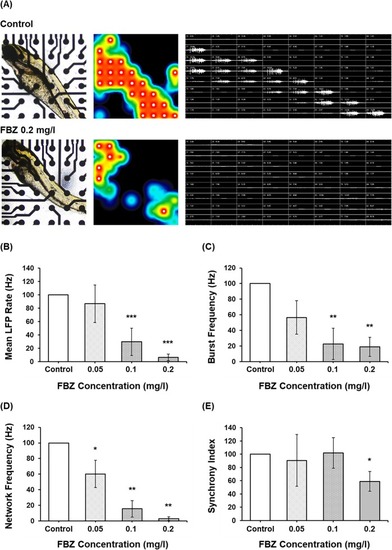
(A) Representative heat map and waveform images of zebrafish multi-electrode array recording (control and 0.2 mg/l of FBZ). (B) Mean local field potential Rate (Hz), (C) burst frequency (Hz), (D) network burst frequency (Hz), and (E) synchrony index. n = 4 embryos per group. Data represent the mean ± SD. *P < 0.05; **P < 0.01; ***P < 0.001. |
Expression Data
Expression Detail
Antibody Labeling
Phenotype Data
Phenotype Detail
Acknowledgments
This image is the copyrighted work of the attributed author or publisher, and
ZFIN has permission only to display this image to its users.
Additional permissions should be obtained from the applicable author or publisher of the image.
Full text @ Sci. Total Environ.