
Image
|
Figure Caption
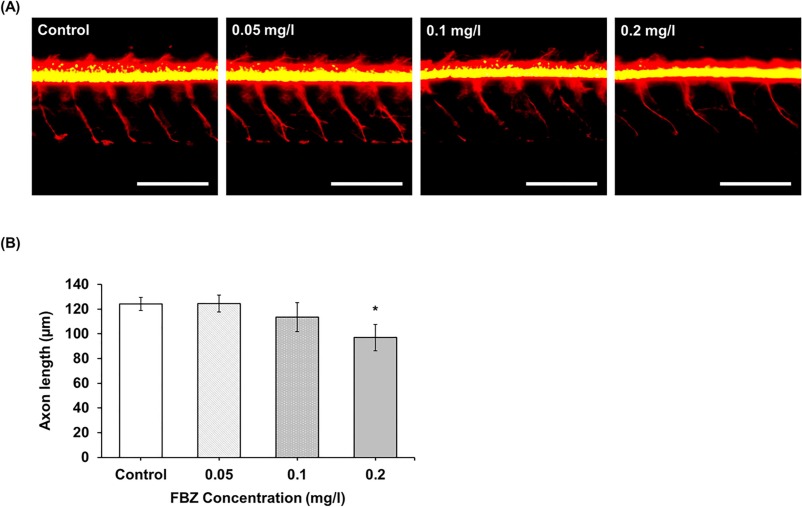
Fig. 5 Axon structure of FBZ-treated transgenic zebrafish at 96 hpf. (A) RFP expressing spinal cord axon in Tg(olig2-dsRED) zebrafish are shown in control, 0.05, 0.1, and 0.2 mg/l FBZ. Scale bar = 150 μm. (B) Axon length of Tg(olig2-dsRED) zebrafish (μm). n = 3 embryos per group. Data represent the mean ± SD. *P < 0.05.
Acknowledgments
This image is the copyrighted work of the attributed author or publisher, and
ZFIN has permission only to display this image to its users.
Additional permissions should be obtained from the applicable author or publisher of the image.
Full text @ Sci. Total Environ.