
|
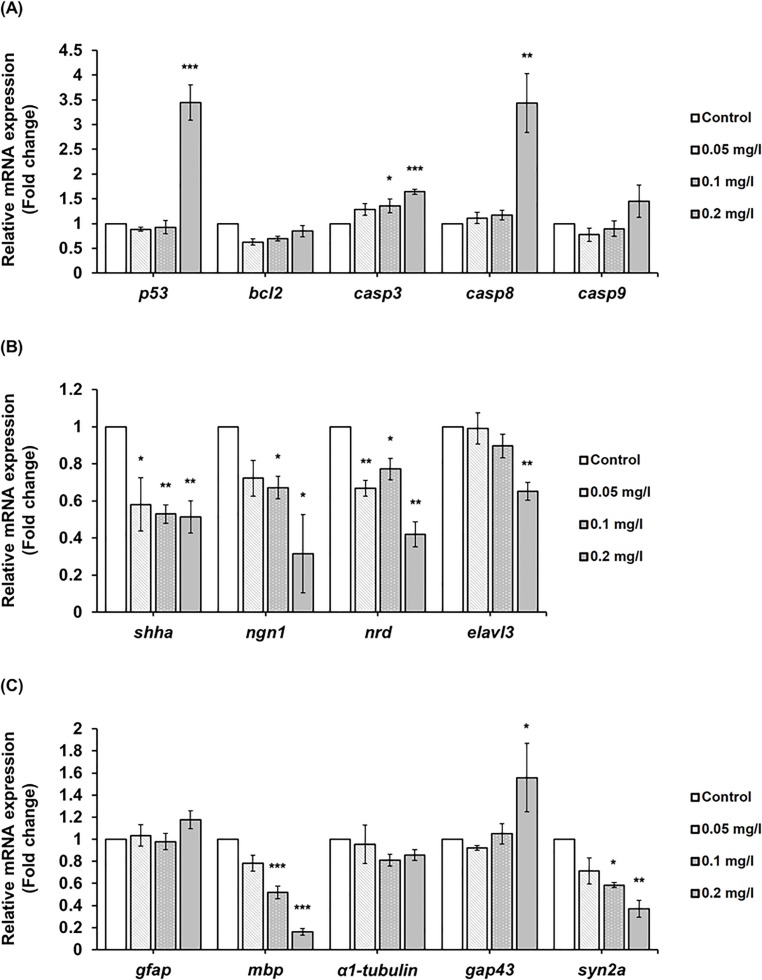
Fig. 4 Gene expression changes following FBZ exposure. The expression of (A) apoptosis-related genes (tumor protein p53 (p53), b-cell lymphoma 2 (bcl2), caspase 3 (casp3), caspase 8 (casp8), and caspase 9 (casp9)), (B) neurogenesis-related genes (sonic hedgehog a (Shha), neurogenin 1 (ngn1), neurod (nrd), and elav like neuron specific rna binding protein 3 (elavl3)), and (C) axon growth and neuronal maturation (glial fibrillary acidic protein (gfap), myelin basic protein (mbp), alpha 1 tubulin (α1-tubulin), growth associated protein 43 (gap43), and synapsin IIa (syn2a)). Data are quantified with standard curves using elongation factor 1-alpha (ef1α) and actin, beta 1 (β-actin) as a reference gene and normalized to control. Data represent the mean ± SD. *P < 0.05; **P < 0.01; ***P < 0.001.