- Title
-
The molecular mechanism of three novel peptides from C-phycocyanin alleviates MPTP-induced Parkinson's disease-like pathology in zebrafish
- Authors
- Xu, F.H., Qiu, Y.Z., Zhang, Y., Yang, F.H., Ji, M.M., Liu, K.C., Jin, M., Zhang, S.S., Li, B.
- Source
- Full text @ Food Funct
|
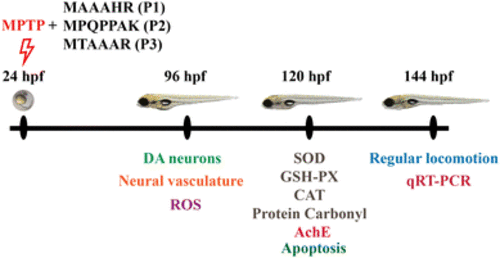
The experimental workflow chart. Larvae at 24 hpf were dechorionated and co-exposed to 70 μM MPTP and three different concentrations of C-PC peptides (12.5, 25, and 50 μg mL−1, respectively). The analyses of the dopaminergic neurons, neural vasculature, and ROS content were conducted at 96 hpf. The levels of oxidative stress indicators, apoptosis, and acetylcholinesterase (AChE) activity were detected at 120 hpf. At 144 hpf, the treated zebrafish larvae were subjected to evaluations of locomotor behavior and expressions of genes associated with oxidative stress, autophagy, and apoptosis. |
|
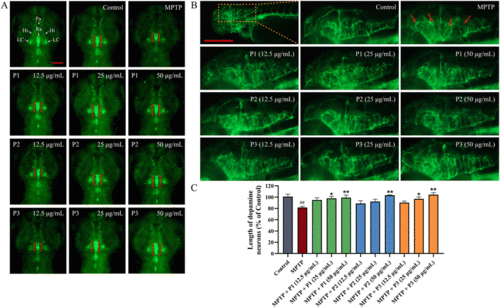
The protective effects of the peptides on dopamine (DA) neurons and blood vessels in MPTP intoxicated zebrafish. (A) Representative fluorometric images of the length of the DA neuron region of the different groups. DA neurons are indicated by the red brackets. Scale bar is 100 μm. (B) Representative fluorometric images of the blood vessels of the different groups. The loss of vasculature is indicated by the red arrows. Scale bar is 200 μm. (C) Statistical analysis of the length of the DA neuron region as shown in (A). Data are presented as percentage of the control group (n = 10). ##p < 0.01 vs. the control; *p < 0.05 and **p < 0.01 vs. the MPTP group. |
|
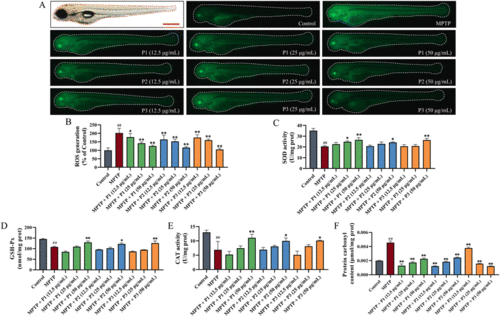
Effect of the three peptides on the MPTP-induced ROS and oxidative stress indicators. (A) The representative ROS fluorescence images. Scale bar, 200 μm. (B) The levels of ROS production. Data are expressed as percentage of the control group (n = 10). ##p < 0.01 vs. the control; *p < 0.05 and **p < 0.01 vs. the MPTP group. (C) SOD activity. (D) GSH-Px activity. (E) CAT activity. (F) Protein carbonyl content. (n = 60, ##p < 0.01 vs. the control; *p < 0.05 and **p < 0.01 vs. the MPTP group). |
|
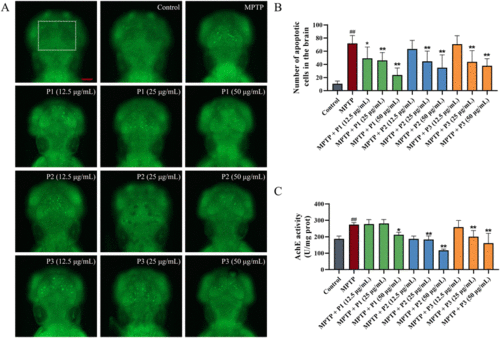
Effects of the three peptides on MPTP-induced apoptosis in AB zebrafish. (A) Representative fluorescence microscopy images of acridine orange staining. Scale bar, 100 μm. (B) The number of apoptotic cells in the zebrafish larvae heads stained with AO (n = 10, ##p < 0.01 vs. the control; *p < 0.05 and **p < 0.01 vs. the MPTP group). (C) AChE activity. (n = 60, ##p < 0.01 vs. the control; **p < 0.01 vs. the MPTP group). |


