
Image
|
Figure Caption
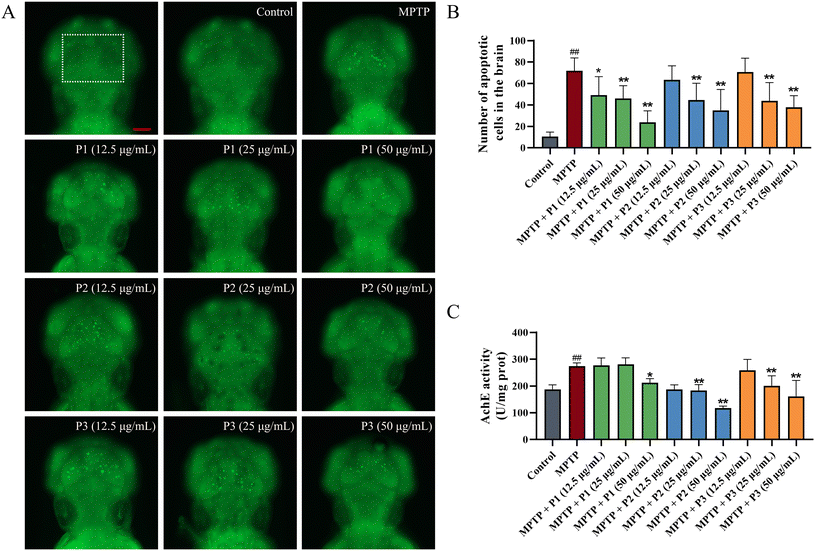
Fig. 7 Effects of the three peptides on MPTP-induced apoptosis in AB zebrafish. (A) Representative fluorescence microscopy images of acridine orange staining. Scale bar, 100 μm. (B) The number of apoptotic cells in the zebrafish larvae heads stained with AO (n = 10, ##p < 0.01 vs. the control; *p < 0.05 and **p < 0.01 vs. the MPTP group). (C) AChE activity. (n = 60, ##p < 0.01 vs. the control; **p < 0.01 vs. the MPTP group).
Acknowledgments
This image is the copyrighted work of the attributed author or publisher, and
ZFIN has permission only to display this image to its users.
Additional permissions should be obtained from the applicable author or publisher of the image.
Full text @ Food Funct