FIGURE SUMMARY
Title

A Role for Microsomal Glutathione Transferase 1 in Melanin Biosynthesis and Melanoma Progression

Authors
Zhang, J., Ye, Z.W., Bräutigam, L., Chakraborty, P., Luo, Z., Culpepper, J., Aslam, M., Zhang, L., Johansson, K., Haeggström, J.Z., Xu, J., Olsson, M., Townsend, D.M., Mehrotra, S., Morgenstern, R., Tew, K.D.
Source
Full text @ J. Biol. Chem.

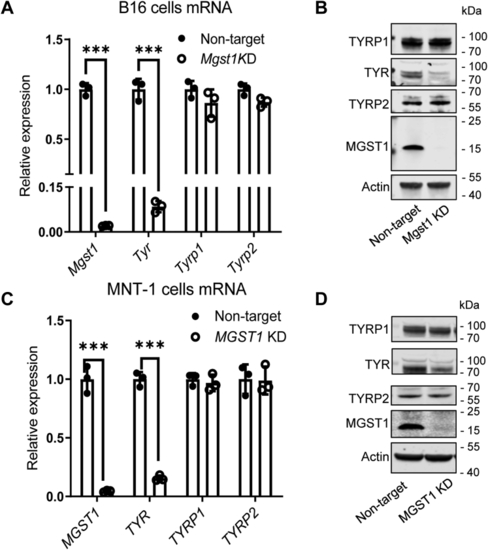
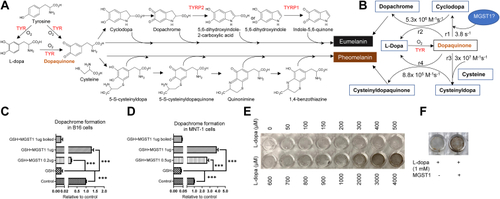
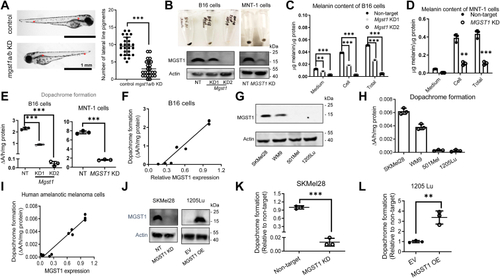
MGST1 positively regulates melanogenesis.A, knockdown (KD) of mgst1a/b in zebrafish was achieved using antisense morpholinos. mgst1a/b KD zebrafish have decreased numbers of melanocytes localized in the midline of the embryos (between the two stars) compared to control morpholino zebrafish (n = 25/group). B, KD of MGST1 in mouse B16 and human MNT-1 melanoma cells was achieved using lentiviral shRNA. MGST1 silencing was confirmed by Western blot. MGST1 KD B16 and MNT-1 cell pellets show decreased pigmentation compared to nontarget (NT) shRNA control B16 and MNT-1 cell pellets. C and D, total melanin content (both intracellular and secreted) was measured by spectrophotometric assays in B16-NT, B16-KD1, B16-KD2, MNT-1 NT, and MNT-1 KD cells. E, dopachrome formation from L-dopa was measured in whole cell lysates from B16 NT, B16 Mgst1 KD1, B16 Mgst1 KD2, MNT-1 NT, and MNT-1 MGST1 KD cells. F, linear correlation between dopachrome formation and amounts of MGST1 in B16 cells. G, MGST1 protein expression in amelanotic SK-Mel-28, WM9, 501Mel, and 1205Lu human melanoma cells. H, dopachrome formation from L-dopa was measured in whole cell lysates from SK-Mel-28, WM9, 501Mel, and 1205Lu cells. I, linear correlation of dopachrome formation with amounts of MGST1 in SK-Mel-28, WM9, 501Mel, and 1205Lu cells. J, KD or overexpression (OE) of MGST1 in SK-Mel-28 cells or 1205Lu cells was achieved using lentiviral systems. MGST1 silencing or overexpression was confirmed by Western blot. K and L, dopachrome formation from L-dopa was measured in whole cell lysates from SK-Mel-28-NT, SK-Mel-28-KD (K), 1205Lu-EV, and 1205-OE (L) cells. ∗∗ and ∗∗∗ indicate p < 0.005, and p < 0.0005, respectively. MGST, microsomal glutathione transferase.

Lack of MGST1 interrupts expression of tyrosinase, but not two other melanogenesis-associated enzymes, TYR-related protein 1 and 2.A and B, mRNA and protein expression of Tyr, Tyrp1, and Tyrp2 in B16 NT, B16 Mgst1 KD cells. C and D, mRNA and protein expression of Tyr, Tyrp1, and Tyrp2 in MNT-1 NT and MNT-1 MGST1 KD cells. ∗∗∗ indicates p < 0.0005. KD, knockdown; MGST, microsomal glutathione transferase; NT, nontargeting; TYR, tyrosinase; TYRP, tyrosinase-related protein.

MGST1 is spatially linked to melanosome markers PMEL and TYRP1.A and B, mouse B16 and (C and D) human MNT-1 cells were fixed and stained with anti-rabbit MGST1 and anti-mouse PMEL or anti-mouse TYRP1 antibodies along with Alexa-488 (green for rabbit) and Alexa-555 (red for mouse). Green and red fluorescence was imaged with an inverted Zeiss LSM880 laser scanning confocal microscope using a 40× water immersion super apochromat objective. Images shown are representative of three or more experiments. Colocalization was analyzed by Zen Blue software. A and C, red channel for anti-mouse PMEL and green channel for anti-rabbit MGST1. B and D, red channel for anti-mouse TYRP1 and green channel for anti-rabbit MGST1. Bar graphs showed the Manders coefficients for each channel. MGST, microsomal glutathione transferase; TYRP, tyrosinase-related protein.

MGST1, as a dopaquinone cyclase, promotes eumelanin formation.A, biosynthetic pathways leading to eumelanin and pheomelanin production. B, rate constants for the early-stage reactions. C and D, dopachrome formation from L-dopa was measured in whole cell lysates from B16 and MNT-1 cells in the presence of 5 mM GSH and recombinant MGST1 (active or inactivated). E and F, oxidation of L-dopa in the absence or presence of recombinant MGST1. ∗∗∗ indicates p < 0.0005. MGST, microsomal glutathione transferase; TYR, tyrosinase; TYRP, tyrosinase-related protein.

MGST1 knockdown melanoma cells exhibit higher oxidative stress and lower antioxidant capacities.MGST1 KD B16 and MNT-1 cells possess increased levels of ROS (A) and decreased total antioxidant capacities (B), with diminished GSH/GSSG (C) and NADPH/NADP (D) ratios. ∗, ∗∗, and ∗∗∗ indicate p < 0.05, p < 0.005, and p < 0.0005, respectively. KD, knockdown; MGST, microsomal glutathione transferase; ROS, reactive oxygen species.

Metabolic profiling of B16 and MNT-1 melanoma cells. NT and MGST1 KD cells were used for quantifying intracellular metabolites using LCMS. A and B, principal component analyses show distribution of the metabolites between NT and Mgst1 KD B16 and MNT-1 cells. C and D, relative amounts of metabolites evaluated between NT and MGST1 KD B16 (C) and MNT-1 (D) cells. KD, knockdown; MGST, microsomal glutathione transferase; NT, nontargeting.

Knockdown of MGST1 suppresses melanoma migration in vitro.A, cellular ATP levels were measured where luminescence signals generated by luciferase are proportional to cellular ATP levels. B, after 10 days in melanoma cell medium, 3D-cultured B16 and MNT-1 KD cells showed significantly less morphological changes (dendrite formation). C, quantification of cell numbers was carried out by measuring DNA content using CyQuant dye. ∗, ∗∗, and ∗∗∗ indicate p < 0.05, p < 0.005, and p < 0.0005, respectively. KD, knockdown; MGST, microsomal glutathione transferase.

Knockdown of Mgst1 suppressed B16 melanoma tumor progression in C57BL/6 mice. C57BL/6 mice were inoculated (subcutaneously, sc) with 0.3 × 106 murine melanoma B16 NT and Mgst1 KD cells on day 0, and starting on day 7, body weights and tumor sizes were measured every day. A, growth curves for B16 melanoma (n = 9/group). B, representative whole-body in vivo bioluminescent images of mice from each group at the end of study. C, digital photograph and (D) weights of excised B16 tumors at the end of study (n = 9/group). E, changes in the body weights of B16 tumor-bearing mice (n = 9/group). F, chemokine expression analyzed by R&D Chemokine Array. Tumor lysates were analyzed for protein content by bicinchoninic acid protein assay (n = 3/group). ∗, ∗∗, and ∗∗∗ indicate p < 0.05, p < 0.005, and p < 0.0005, respectively. KD, knockdown; MGST, microsomal glutathione transferase; NT, nontargeting.

Tumor-induced immunosuppression is reduced with the Mgst1 KD strategy in C57BL/6 mice.A, frequency of intratumor lymphocytes analyzed by flow cytometry (n = 5/group). B, tumor-infiltrated lymphocytes retrieved from the tumor-bearing mice were used to determine either surface expression of PD1, TIM3, KLRG1, and LAG3 (n = 4/group) or (C) were activated in vitro with phorbol 12-myristate 13-acetate and ionomycin (500 ng/ml) and assessed for intracellular IFNγ, TNFα, and Granzyme B production using flow cytometry (n = 5/group). For (B), the adjacent bar graphs represent the cumulative data of mean fluorescence intensity of the cell surface expression of PD1, TIM3, KLRG1, and LAG3 on the tumor-infiltrated CD8+ T cells. For (C), the adjacent bar graphs represent the cumulative data of frequency of cytokine-secreting cells. ∗, ∗∗, and ∗∗∗ indicate p < 0.05, p < 0.005, and p < 0.0005, respectively. KD, knockdown; MGST, microsomal glutathione transferase.

Acknowledgments
This image is the copyrighted work of the attributed author or publisher, and ZFIN has permission only to display this image to its users. Additional permissions should be obtained from the applicable author or publisher of the image. Full text @ J. Biol. Chem.