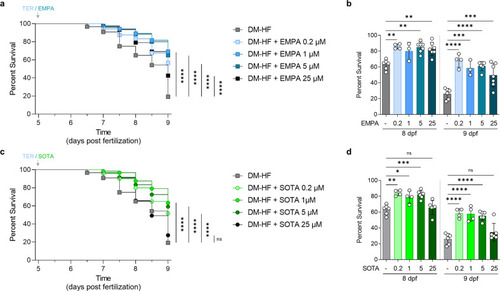
Comparison of survival rates in DM-HFrEF model zebrafish treated with empagliflozin or sotagliflozin.

Survival analysis of DM-HFrEF zebrafish larvae after treatment with 0.2, 1, 5 and 25 μM empagliflozin or sotagliflozin. a, c Kaplan‒Meier survival curves (n = 120 larvae per group). b, d Ccross-sectional comparisons at the time points of 8 and 9 dpf and are presented as the mean ± standard deviation; each dot represents the value from one experiment (n = 3–6 experiments per group). The non-DM and DM groups were tested under the same conditions on the same day, and the graph is shown in Fig. 1 and Supplementary Fig. 2. *p < 0.05, **p < 0.01, ***p < 0.001, ****p < 0.0001 vs. the indicated group.

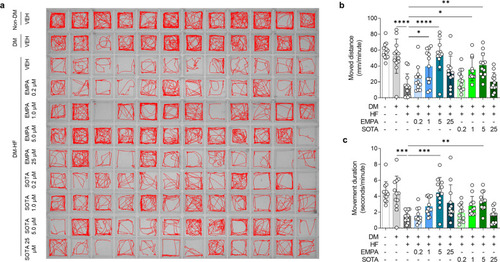
Comparison of locomotion in DM-HFrEF zebrafish treated with empagliflozin or sotagliflozin.

a Representative locomotion tracking images of zebrafish larvae for a 5-minute period. b, c Average movement distance and movement duration per 1 min (n = 12 larvae per group). Data are presented as the mean ± standard deviation, and each dot represents the value for one zebrafish larva. *p < 0.05, **p < 0.01, ***p < 0.001, ****p < 0.0001 vs. the indicated group.

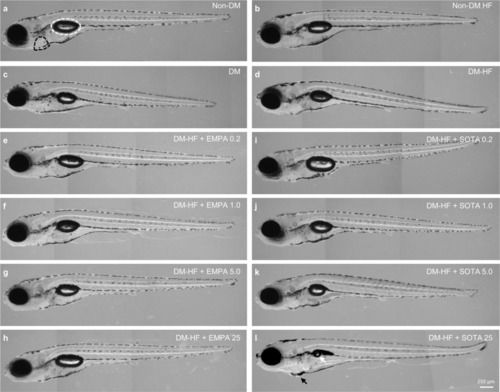
Comparison of morphology in DM-HFrEF zebrafish treated with empagliflozin or sotagliflozin.

Representative morphological images. a Non-DM, b non-DM with HFrEF, c DM, d DM-HFrEF. el DM-HFrEF zebrafish following treatment with e 0.2 μM, f 1 μM, g 5 μM and h 25 μM empagliflozin or i 0.2 μM, j 1 μM, k 5 μM, and l 25 μM sotagliflozin. a The pericardium is indicated by a black dashed line, the swim bladder by a white dashed line, l the pericardial edema by a black arrow, and uninflated swim bladder by a white arrow.

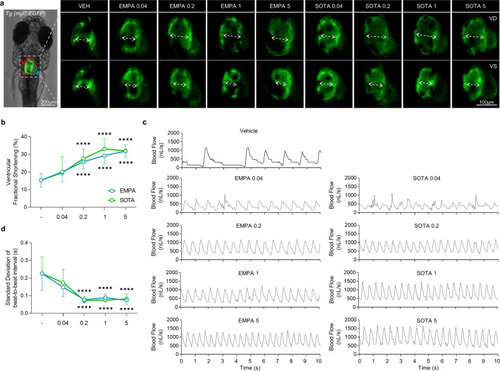
Comparison of cardiac contraction in DM-HFrEF zebrafish treated with various concentrations of empagliflozin or sotagliflozin.

a Representative fluorescence microscopy images of TG (myl7:EGFP) zebrafish hearts at end-diastole and end-systole of ventricle. b Ventricular fractional shortening calculated based on fluorescent images (n = 8–25 larvae per group). c Representative blood flow graphs. d Standard deviation of the beat-to-beat interval analyzed based on blood flow (n = 14–25 larvae per group). b, d Data are presented as the mean ± standard deviation. ****p < 0.0001 vs. control group.

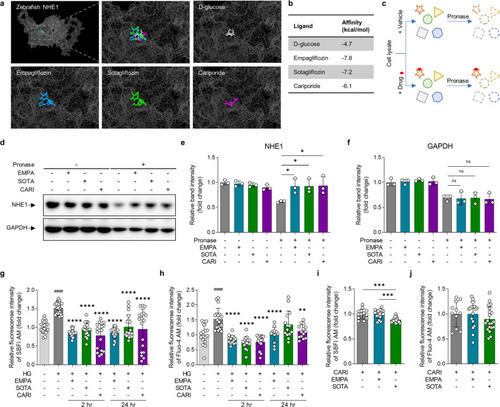
Comparison of structural binding and functional inhibitory effects of empagliflozin and sotagliflozin on NHE1.

a, b Molecular docking analysis of empagliflozin, sotagliflozin, cariporide and D-glucose binding to a structural model of zebrafish NHE1 in silico. Empagliflozin is shown in blue, sotagliflozin is shown in green, cariporide is in purple, and D-glucose is in gray. D-glucose was used as a negative control, and cariporide was used as a positive control. a Binding site and b affinities. c Schematic illustration of the drug affinity responsive target stability (DARTS) assay in vitro. df DARTS analysis by immunoblotting with NHE1 and GAPDH antibodies (n = 3 samples per group). gj Measurement of intracellular Na+ and Ca2+ to analyze the functional inhibitory effects of empagliflozin and sotagliflozin on NHE1. g Changes in intracellular Na+ and h Ca2+ concentrations in cardiomyocyte under HG condition were evaluated after treatment with (n = 14–27 samples per group). i, j Changes in intracellular Na+ and Ca2+ concentrations in response to empagliflozin or sotagliflozin treatment in cells pretreated with cariporide (n = 11–20 samples per group). Data are presented as the mean ± standard deviation, and each dot represents the value of each sample. e, i *p < 0.05, ***p < 0.001 vs. the indicated group. g, h####p < 0.0001 vs. the LG group, **p < 0.01, ****p < 0.0001 vs. the HG group.

Acknowledgments
This image is the copyrighted work of the attributed author or publisher, and ZFIN has permission only to display this image to its users. Additional permissions should be obtained from the applicable author or publisher of the image. Full text @ Exp. Mol. Med.